The stylized facts of the crack-up boom

The Austrian boom phase provides the “illusion” of growth and there are structural reasons why it must unwind. As distinct from other schools of thoughts that rely on amorphous channels of “confidence”, the Austrian story contains the seeds of recession within the boom. To sum up the theory in a nutshell:

“True, governments can reduce the rate of interest in the short run. They can issue additional paper money. They can open the way to credit expansion by the banks. They can thus create an artificial boom and the appearance of prosperity. But such a boom is bound to collapse soon or late and to bring about a depression” Mises (1944) p.251

ABC rests on the claim that artificial credit expansion leads to unsustainable investment projects. Easy money and subsequent low interest rates encourage firms to borrow money and invest in interest-sensitive projects, and for consumers to consume rather than save. As Garrison (2001) points out this causes the economy to pull in two directions at once: cheap credit is fuelling malinvestment, whilst strong consumer demand leads to over consumption. The typical assumption is that this “tug of war” over the stock of real resources tends to be “won” by the business sector, because they are closer to the source of credit creation.

The problem stems from the separation of credit and prior production (i.e. savings). Credit allows us to draw upon expected future income streams; therefore if we use credit to fund investment we are anticipating that the value of those future goods will exceed the interest costs of the loans. But note that if we draw upon future income for present consumption, we’re merely engaged in capital consumption. The problem occurs when we systematically overestimate future incomes, and borrow against future income/profits that doesn’t materialise. Since the interest rate is the signal that provides coordination over time, Austrians tend to focus on the manipulation of it as the cause of these clusters of errors.

When outlining the stylised facts of an “Austrian” business cycle it is again necessary to be wary of the hindsight bias – having recently “experienced” a boom-bust cycle it would be tempting to claim too much. Indeed the intention of this post is not to explain every detail of the cycle, but instead to draw upon the “stylised facts” and compare them with real events. This section of the article is not theoretical, and therefore it is possible that competing explanations also provide a “fit” for the data.

Since most work on the Austrian business cycle theory is academic, there are surprisingly few accounts that commit to outlining how markets will look at various stages. However if this post sought to distil and/or blend existing work it would increase the potential for taking a selective view. Therefore the paucity of literature will be embraced, thus making it easy for readers to verify for themselves that this is a faithful and complete recounting of the sources used! I will rely on two main sources, each providing slightly different points of emphasis. I may be accused of being a little biased, and I can take that. This is, after all, my creed.

“I say “creed” because, for brevity, it is purposely expressed dogmatically and without proof. But it is not a creed in the sense that my faith in it does not rest on evidence and that I am not ready to modify it on presentation of new evidence. On the contrary, it is quite tentative. It may serve as a challenge to others and as raw material to help them work out a better product” (Fisher, 1933 p337).

Oppers (2002) will be used to provide the underlying contours and general description of what Austrian’s might expect to be occurring. Skousen (1988) will be utilised to make specific claims about key indicators and asset classes.

Phase A: The inflationary boom

During the boom it will not be clear that there is a problem, since superficially the main economic indicators will suggest that the economy is running smoothly – there will be robust increases in economic output, low inflation, and strong confidence. Oppers (2002) points to three issues that would concern Austrians, however:

  • “Strong investment demand in particular sectors (this could lead to stronger than warranted building up of production capacity)”
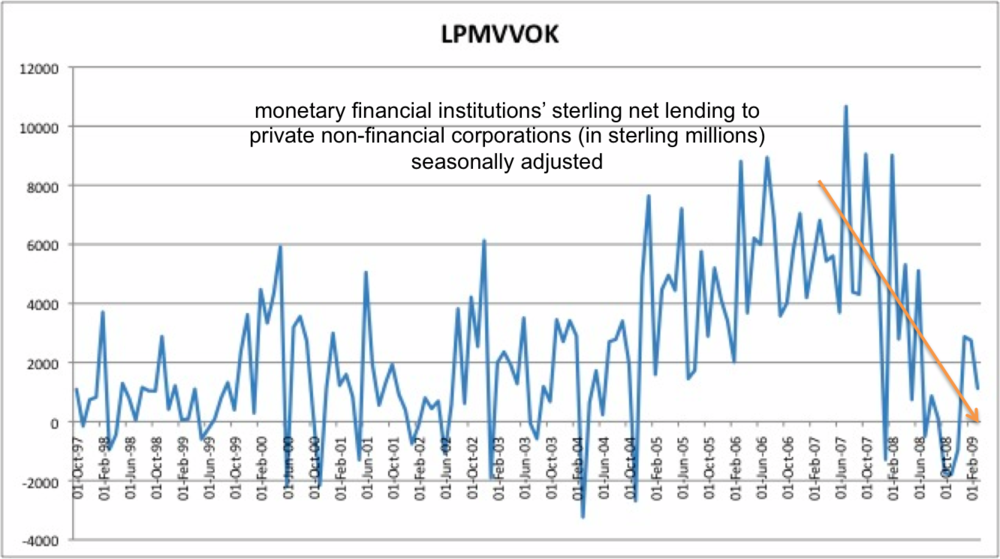
  • “An expansion that is driven by strong growth in credit, especially to enterprises”
  • “a diversion of resources away from the production of consumption goods towards capital goods, with an associated rise in consumer goods prices relative to those of capital goods”[5]

Following Skousen (1988) we can generate four empirical generalisations:

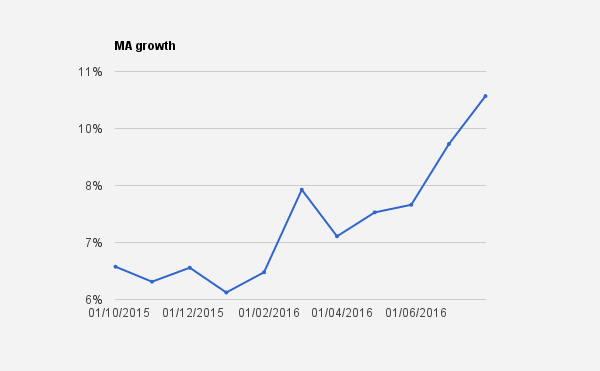
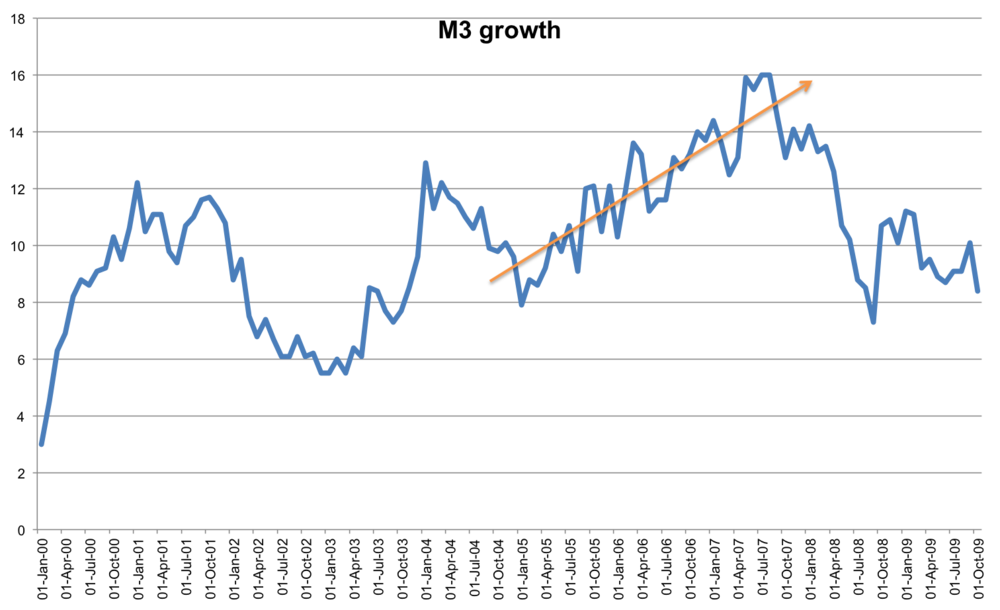
            A1: an increase in the money supply


It is this that drives the cycle, and is what pushes the interest rate below its “natural rate”. The fact that capital-intensive industries are stimulated leads to two related observations:

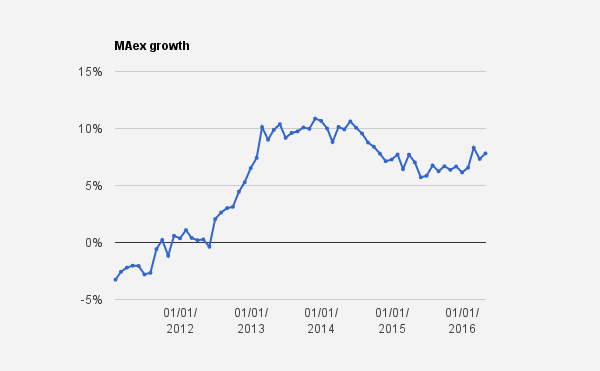
            A2: a rise in corporate profits and

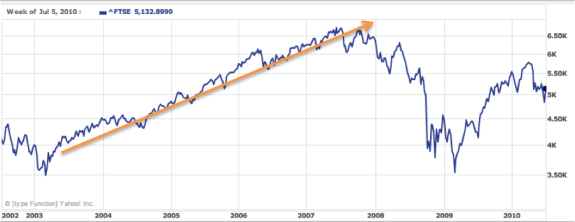
            A3: a stock market boom


Finally,

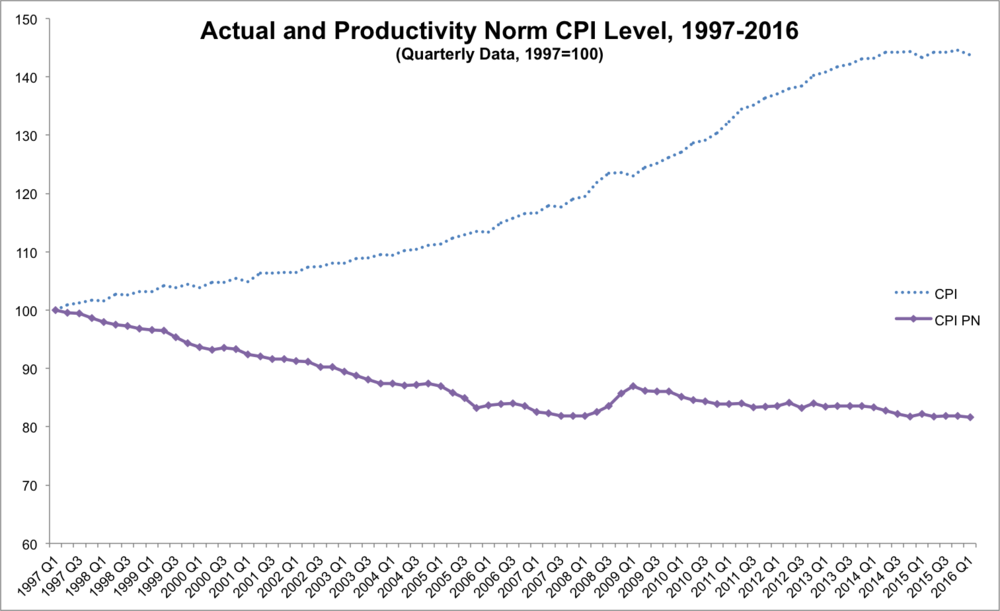
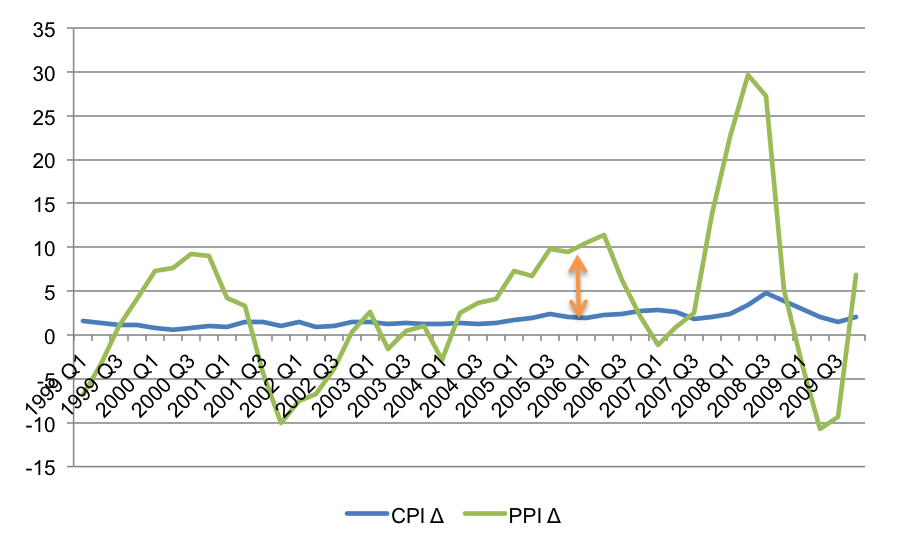
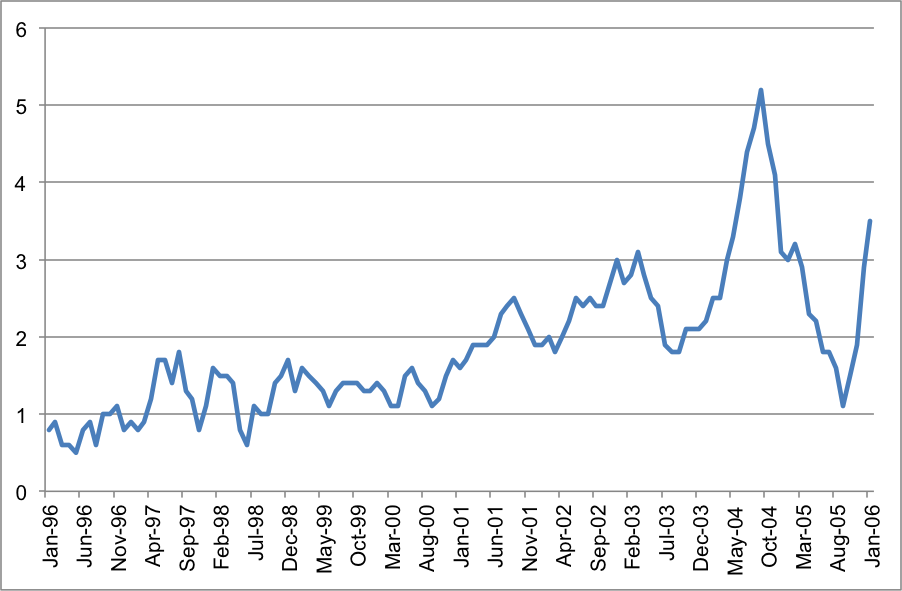
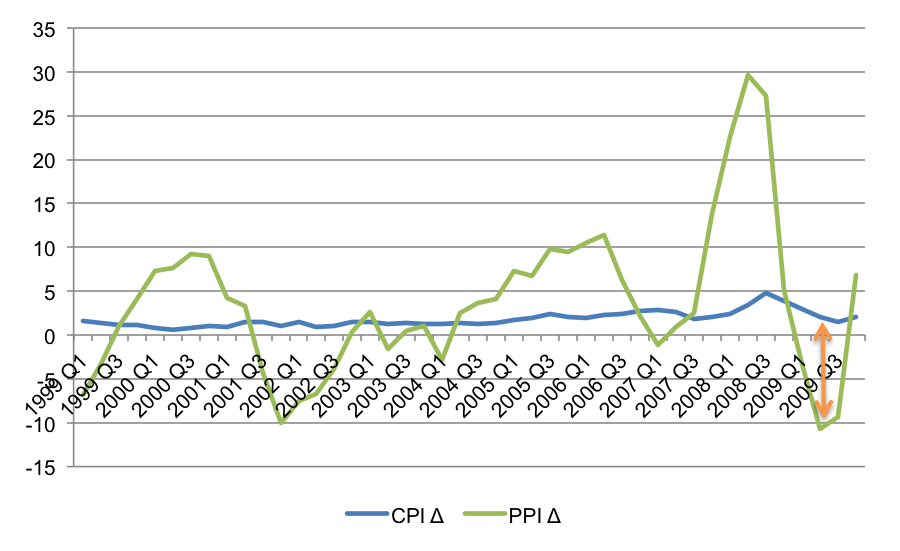
            A4: the producer price index rises faster than the consumer price index

 Phase B: The credit crisis

The credit crisis itself might be considered a “moment”, however we can attribute several observable events to this phase of the cycle. This is the point at which “earlier malinvestment becomes apparent” (Oppers 2002), or where the “illusion” of growth is revealed. Again, Oppers (2002) provides commentary:

  • “a capital stock that is badly matched to the structure of demand”
  • “excess capacity in certain sectors, and a lack of capacity in others”
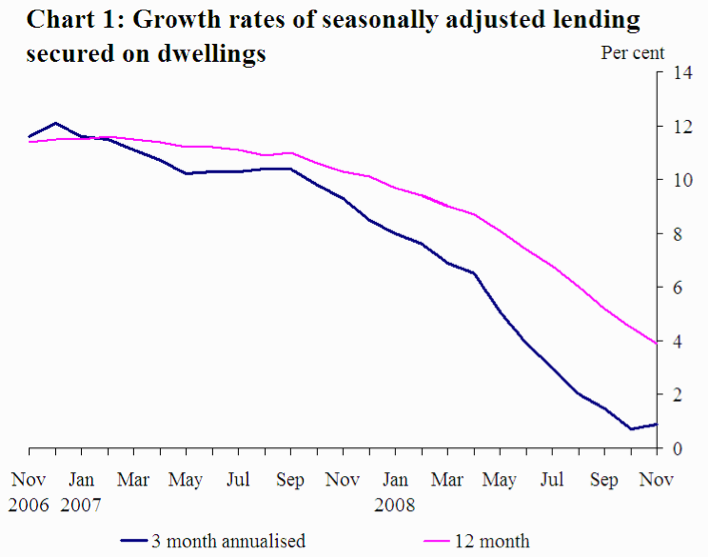
  • “the slump would likely also be felt strongly… in the banking sector, which would see its loan portfolio deteriorate, as highly leveraged investment projects undertaken during the boom prove to be unprofitable”

According to Skousen (1988) this phase of the boom will manifest itself in the following ways:

            B1: The consumer price index begins to catch up with the producer price index


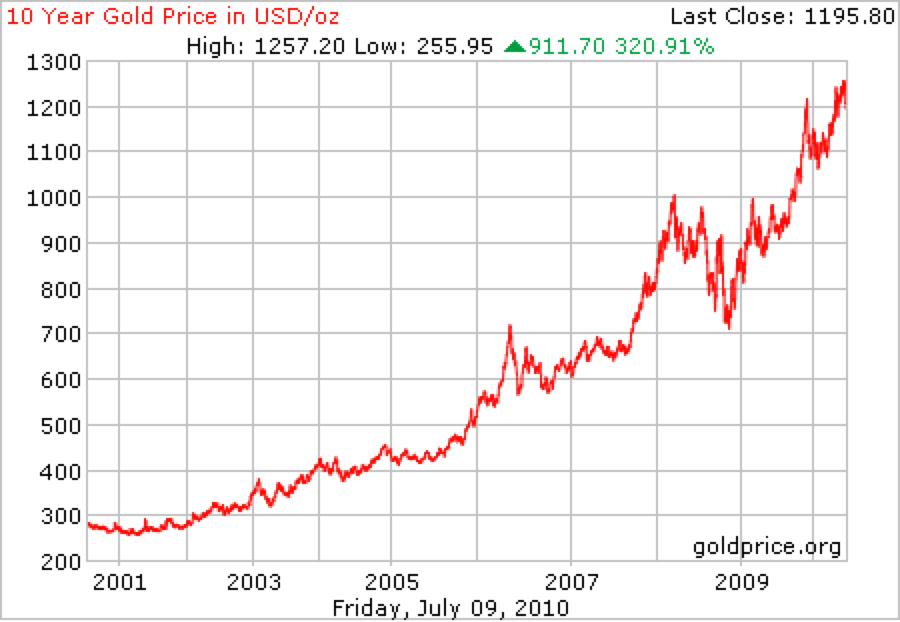
This leads investors to flee into inflation hedges, leading to:

B2: A rising gold price

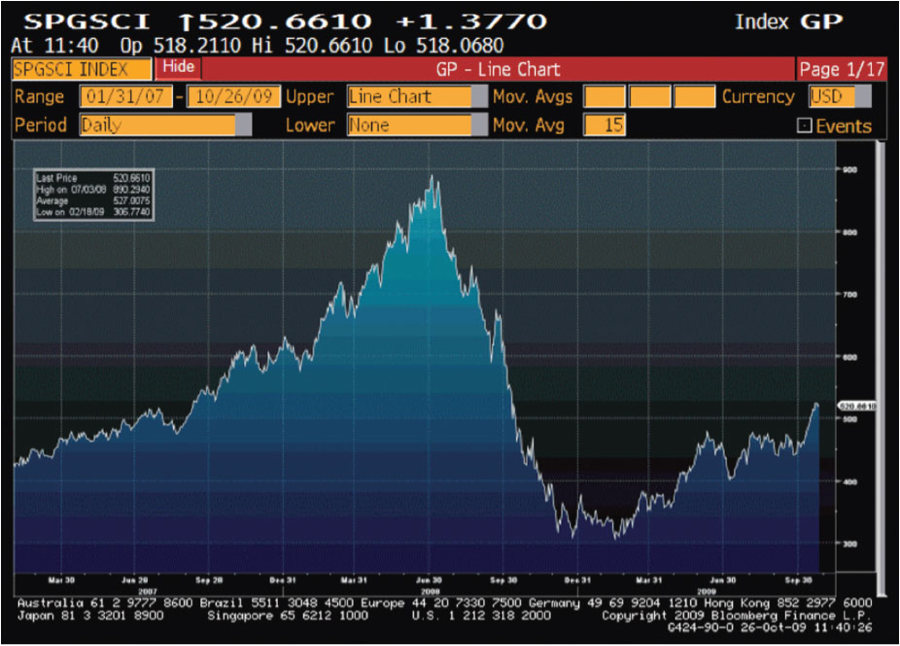
B3: A rise in the price of commodities


The fourth impact will be

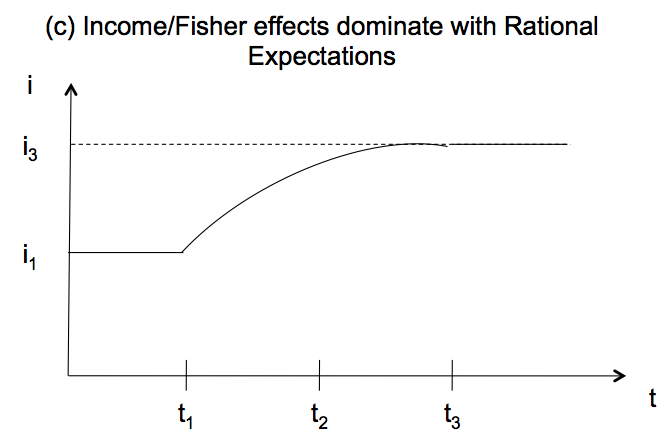
            B4: Rising pressure on interest rates 


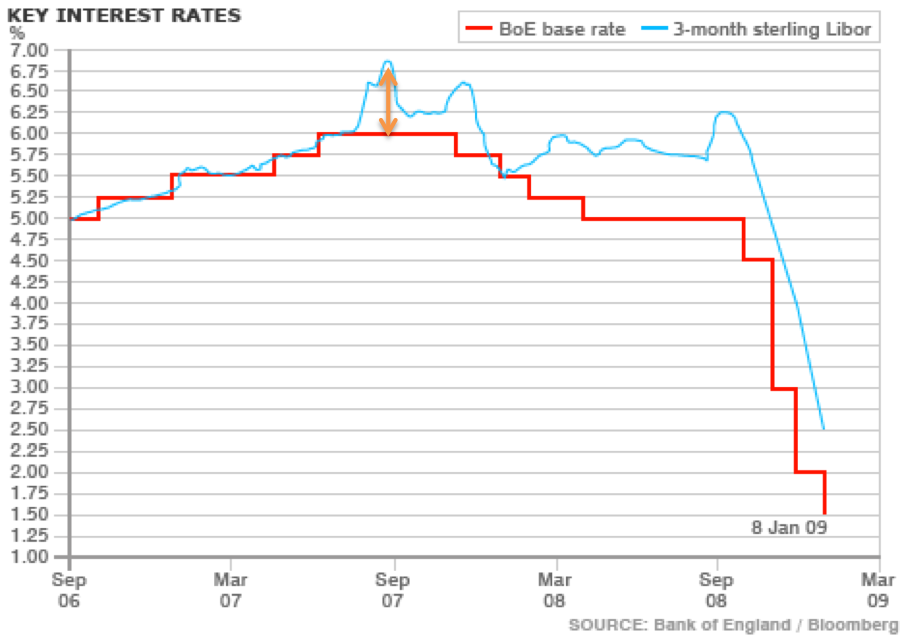
And this stems from two forces. On the one hand the manifestation of consumer price inflation will likely lead to policy responses from the central banks. Also, higher interest rates will reflect the fact that banks seek to call in loans to preserve their balance sheets, reflecting

            B5: Banks and corporations scramble for funding


Phase C: The recession

During the recessionary phase the policy debate comes to the fore, as Oppers (2002) writes:

  • “they [Austrians] see demand-stimulating policies after the cyclical peak as merely postponing (and thus potentially aggravating) the correction of past excesses”
  • “an economy in recession does not respond well to expansionary monetary and fiscal policies”

However the recession itself is a fairly unambiguous phenomena, and we would expect to witness typical economic indicators:

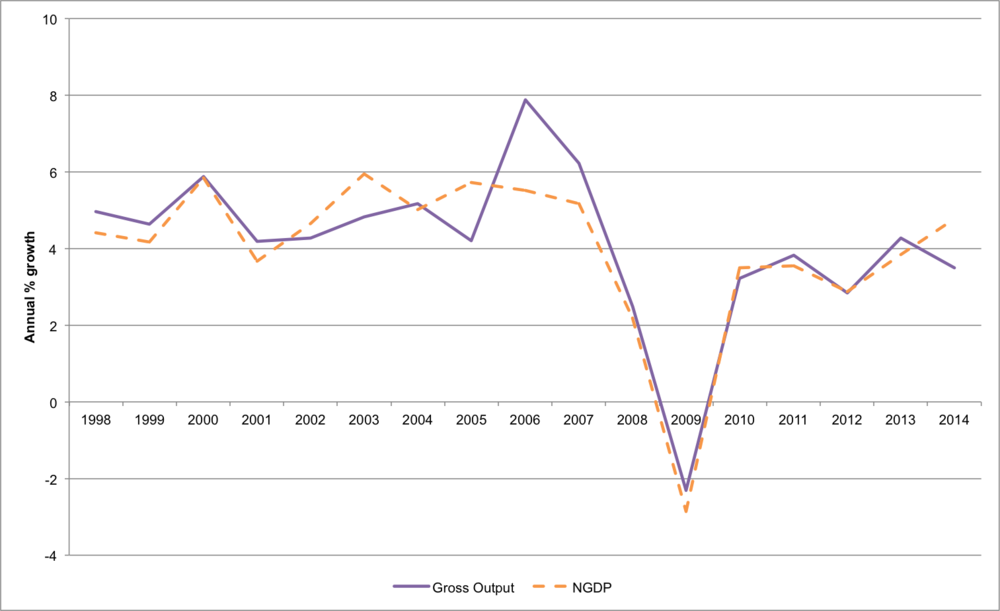
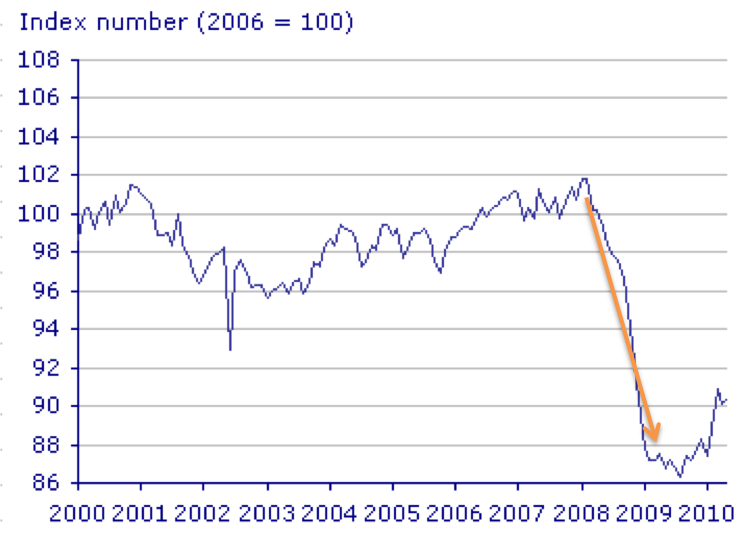
            C1: Production of capital goods falls more sharply than consumer goods. (There is evidence that activities furthest from consumer spending were more severely affected by the recession. Whereas the service sector saw a year on year decline of 3.1%, industry fell by 12.5% whilst construction fell by 13.2% (Giles, C., and Pimlott, D., “UK economy shrinks most in 50 years” Financial Times, June 30th 2009)). As Hayek says,

“It is the decline in investment (or in the production of producer goods) and not the impossibility of selling consumer goods at remunerative prices, which characterises the beginning of the slump” (Hayek 1932)
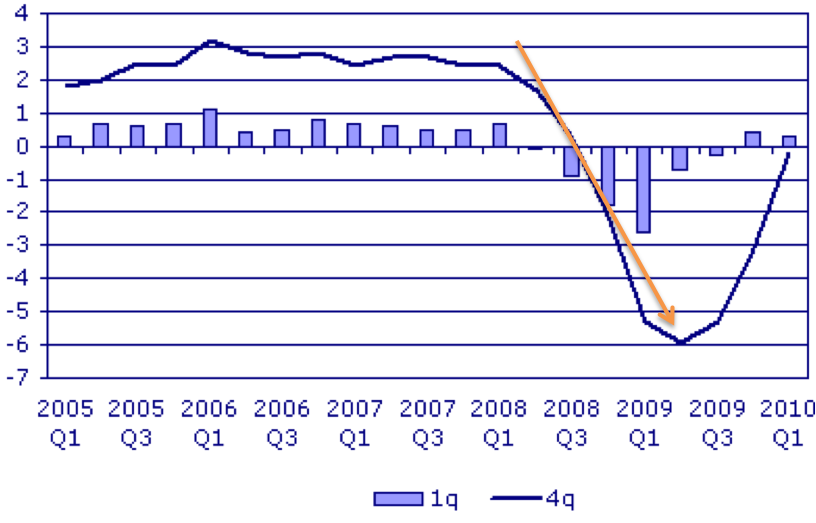
C2: A fall in GDP

C3: A rise in unemployment

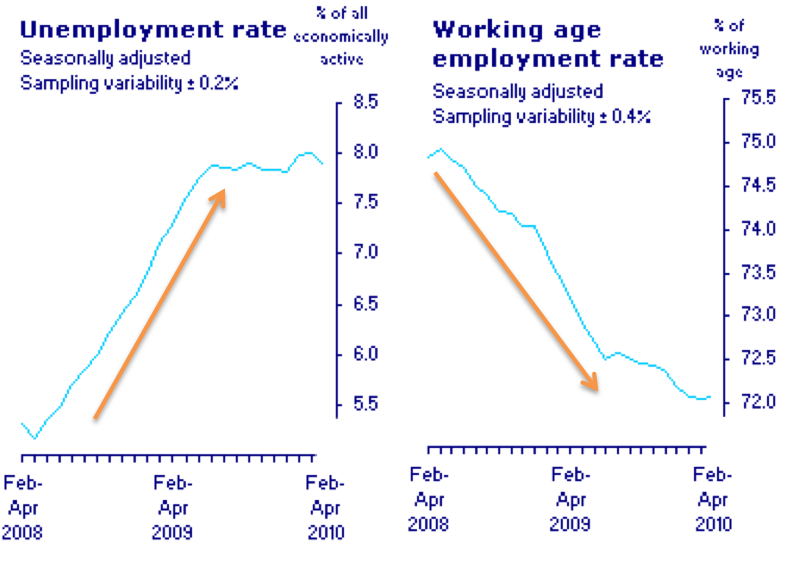
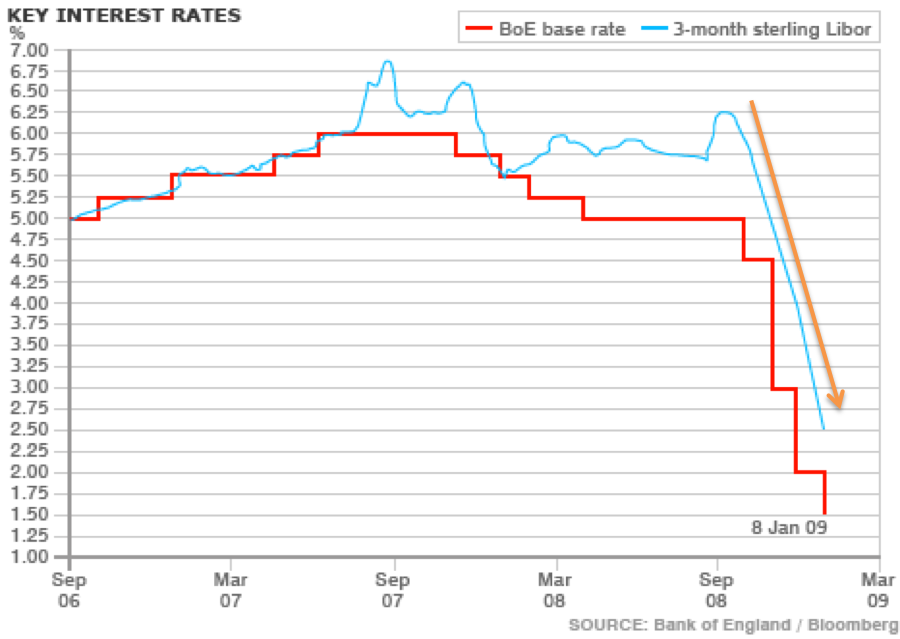
Since the demand for credit declines and central banks engage in expansionary monetary policy we would expect:

            C4: Falling pressure on interest rates


And finally:

C5: The producer price index falls by more than the consumer price index

We can also draw upon Fisher’s (1933) debt-deflation theory sand outline 9 stages of liquidation. These are, (i) distress selling; (ii) reduction in velocity of deposit currency; (iii) fall in the price level; (iv) fall in the net worth of businesses; (v) fall in profits; (vi) reductions in output and employment; (vii) reduction in confidence; (viii) hoarding and further reduction in velocity; (ix) fall in nominal interest rates, rises in real interest rates.

Phase D: The recovery

I think that “the recovery” is an analytically distinct phase to “the recession” even if in practice they tend to coincide. However in reality the likelihood that government responds proactively to “the recession” means that genuine recovery is often jettisoned in favour of a return to an inflationary boom. Despite this we may retain a fourth phase – after the adjustment costs have been borne, and the fruition becomes evident.

I find the evidence compelling.

New estimates of productivity norm inflation

The "productivity norm" is the assertion that prices should be allowed to vary depending on changes to the unit cost of production. In quantity theory terms it says that permanent technology shocks that alter real output should be permitted to manifest themselves in inflation. Under inflation targeting, this doesn't happen. Central banks attempt to alter aggregate demand such that P is stable. A productivity norm ensure that supply shocks affect P, but demand shocks do not. This is because aggregate demand (ie MV) is stable. This is similar to advocating an NGDP target of 0%.

In March last year I tried to replicate the chart below, from George Selgin's "Less than Zero":

I'm not sure why the link is dead, but I thought I would try again, and appreciate help from George (although the usual disclaimer applies). Using CPI data (series code D7BT) and labour productivity (A4YM) and rebasing to 1997, I came up with the following:


I used the following formula:

Ideally, one would use Total Factor Productivity but there's only an annual estimate in the UK. The most recent version was released in May, and covers 2014. Using that data, we can see the following:

This tells an interesting story - it suggests that a productivity norm would have permitted a mild deflation in the years prior to the financial crisis, as the UK economy enjoyed productivity improvements. I tend to view the 2008 inflation shock as being the Ricardo effect, and of course it was the coincidence of an jump in prices right when the economy was entering recession that caused central banks to permit a secondary recession. If they had been following a productivity norm then they'd have allowed inflation to raise even higher.

I wanted to have a regular series, and so I've used the quarterly growth figures for labour productivity to will regularly update the data section. It remains a work in progress. 

Thoughts on the savings glut hypothesis

The “global savings glut” thesis was coined by Ben Bernanke in 2005, and refers to the notion that downward pressure on US interest rates was predominantly caused by excess savings in foreign trading partners such as China. One way to view this debate is that it is commonly believed that a countries current account is driving the capital account (i.e. that the latter is the source of financing for the former). Bernanke essentially pointed out the possibility that the causal arrow is stronger in the opposite direction – that strong demand for US assets (i.e. a capital account surplus) was driving the current account deficit.

In their case for the global savings glut thesis, Henderson and Hummel (2008) acknowledge that US interest rates were below their natural rate, but claim that Greenspan’s policy was “tight”. Selgin (2008) responded by downplaying measures of the money supply in favour of the interaction of the money supply and the demand for money. His argument is that if the PY side of the equation of exchange is volatile than so must MV by definition.  Interestingly, The Economist considered this in 2005, using basic IS-LM analysis to demonstrate that an increase in global savings would be revealed as a downward shift in the IS curve, cutting interest rates and reducing output. By contrast a monetary expansion would primarily affect the LM curve, also reducing interest rates but also increasing output. They conclude, that the latter case “seems to fit the facts more comfortably.

This blog post is simply a few fragmented thoughts on the claims made by Hummel, Henderson, and also Justin Reitz. For simplicity I'll refer to their collective position as HHR.

The HHR argument is along the following lines: the Fed only directly controls the monetary base, and it does so to ensure a stable US domestic price level. Since dollars that are held overseas have little impact on the domestic price level we should exclude them. Hummel and Henderson argue that since the ratio of currency to reserves is determined endogenously by the preferences of banks, it is better to focus on the Fed’s control of reserves, and they point out that reserves have approximately been frozen.

They do suggest that in theory one should really focus on the domestically held monetary base, and Rietz proceeds along these lines. He argues that since the currency held overseas has no direct impact on the domestic price level this should not count as evidence against a loose Fed policy. Indeed when foreign holdings of currency is stripped out he shows that the monetary base expanded by merely 2% per year. This supports Hummel & Henderson.

HHR makes an intriguing claim – not only that the Fed has been pursuing a de facto free banking monetary policy (i.e. keeping the base essentially frozen and then allowing fractional reserve banks to expand and contract the money supply on top of that to respond to changes in the demand to hold money), but that this is the true cause of the Great Moderation. No wonder they are surprised that Selgin doesn’t want to take credit for it! Rather, the bit that Greenspan was directly responsible for resembled a Free Banking environment.

But of course the incentive system within the existing regime (e.g. deposit insurance etc) means that the demand for money does not reflect voluntary behavior. HHR would say “but that’s not the Fed’s fault! Blame congress” and I sympathise. But regardless of whose fault it is it is at best an approximate free banking environment, and no one has argued that by resembling a free banking regime on one margin (whilst other margins are non free banking) is an improvement. Again, this comes down to whether you treat the regime as fixed, or expect the central bank to try to use what powers they do have to compensate for problems with the regime.

HHR don’t argue that the Fed didn’t play a role in generating the crisis. They merely show that it wasn’t within their narrow remit to prevent it. In isolation, a Fed that tries to limit its sphere of influence and sticks to approximating a free banking policy is a good thing. But in a world were governments create even bigger errors – whether foreign (in terms of their currency manipulation) or domestic (in terms of their addiction to debt financing) – maybe we should hold central bankers to a higher standard.

Special report on natural interest rates

I've made two previous efforts to calculate the natural interest rate for the UK, and you can find them here:

I've just written a short paper talking about why the natural rate is important, and a (very) brief summary of some recent efforts to estimate it. You download it here (data here). The charts are up through 2015, but I thought it would also be interesting to incorporate it in our data section. The chart belows shows the present situation, and as of 2016 Q2 the natural real rate was 1.8%. Using the GDP deflator as an inflation measure, this implies a nominal rate of 2.34%. With market rates (I use SONIA) at 0.47% this implies monetary policy is too loose.

The lethargic recovery

I was talking today about why I thought the UK's recovery was lethargic, back when we thought that it was (we now think it was signficently better). There's obviously  a number of factors, and I wouldn't paint government policy as the sole determinant. We can split them into 6 main categories:

  • Falling real incomes: Household consumption has been squeezed via low wage increases and high inflation. CPI has been above the 2% target since December 2009 reaching 5.2% in September 2011. As already mentioned huge open ended tax liabilities and tax uncertainty has dampened spending with signs that consumers are factoring future debt burdens into their present consumption choices, “indebted consumers seem more interested in paying down what they owe than splashing out on flat-screen televisions” 
  • Low business confidence: not just because of low demand, but also due to Robert Higg’s concept of “regime uncertainty”. This results from the erosion of investor’s confidence in private property rights, and there is evidence that this occurred in the UK following the crisis.
  • Distressed export markets: since the financial crisis the trade-weighted value of the pound has fallen by about 20%, however 45% of exports go to countries within the Eurozone meaning that the UK is highly dependent on Eurozone growth.
  • Breakdown in financial intermediation: Bank lending has been weak, in large part due to new Basel rules that intend to encourage banks to hold more reserves. Evidence suggests that any gains from quantitative easing were almost totally offset by stricter capital requirements imposed by regulators.  In addition the recession directly followed a banking crisis that resulted in the government nationalising the four largest lenders in the country.  According to Reinhart and Rogoff, “the aftermath of banking crises is associated with profound declines in output and employment” , and the conventional view is that balance sheet repair takes time.  This may especially hold if accompanied by a housing bust – and the UK had one of the largest housing bubbles.
  • Regulatory problems: not only had much of the productive capacity of the economy been hollowed out prior to the financial crisis, there has been little supply side reforms as part of the recovery. The list of regulatory reforms in recent Budgets is underwhelming, treating government investment in infrastructure as being synonymous with supply side growth. Meanwhile airports are constrained by planning laws, housing developers can’t build new housing and small businesses are stifled by red tape.  In addition high marginal tax rates across the tax schedule dampens incentives and hinders growth.
  • Monetary policy mistakes: Similar to the US, interest rates in the UK were kept artificially low in the period building up to the financial crisis creating distortions in the economy. This “malinvestment” sowed the seeds of an inevitable correction, but these problems were compounded by additional monetary policy failures. In terms of the crisis period itself, nominal GDP began to collapse in early 2008 and didn’t reach its pre crisis growth rate of around 5% until late 2010. Some argue that the Bank of England was slow to respond to this – interest rates were 5% in February 2008 and they only began cutting in October (to 4.5%). Quantitative easing didn’t begin until 6 months after the collapse of Lehman Brothers, in March 2009.

In short, there has been a combination of reasons why the UK economy recovered thw way it did. It was vulnerable to a recession and monetary mismanagement compounded fiscal folly. 2008 wasn’t a temporary, irrational pause in spending but a permanent wealth shock.

UK Gross Output grew by 3.49% in 2014

Last month the ONS released the Supply and Use Tables for 2014. You can find them here. They are interesting because they provide a measure of intermediate consumption, which many Austrian economists - who care about the entire "structure of production" - believe is an important missing ingredient of typical national accounts. Indeed it's somewhat odd that Gross Domestic Product strips this economic activity out, making it more of a Net concept. As Sean Corrigan puts it, we want the Hayekian horse (of production) in front of the Keynesian cart (of consumption).

Mark Skousen has advocated a measure that he refers to as "Gross Domestic Expenditure", which incorporates all of the production side of the economy. A close substitute for this is "Gross Output", which, as I've previously mentioned, is now published by the BEA (Skousen adjusts Gross Output by adding Gross sales at a retail and wholesale level, to incorporate even more business spending).

I've made previous efforts to measure Gross Output in the UK, using the Supply and Use Tables. This time, I'ive modified the method. I think the simplest way to approach it is to simply combine NGDP with intermediate consumption. Doing so provides the following side-by-side comparison:


Similar to US estimates, we see that Gross Output is around (in fact just under) twice as large as nominal GDP. The interesting comparison is the growth rates, and Gross Output is more volatile than NGDP:

In 2006 it was growing at 7.88% which indicated an even larger boom that was being shown in NGDP data (which grew by 5.52%). It then contracted by -2.31% in 2009 before picking up again. As with NGDP the post crisis growth rate seems enduringly lower. My main interest was the 2014 figure, and we can see that whilst Gross Output grew faster than NGDP in 2013, this was reversed in 2014. Whilst NGDP delivered a robust 4.77%, Gross Output only grew by 3.49%.

The problem with offering an alternative to GDP is there's a burden to provide a better one, or a more theoretically robust one. I wouldn't claim that I've achieved that, but I think it's worthy of enquiry. And if the recent debate between Vincent Geloso and Scott Sumner (and Marcus Nunes and Vincent again) is anything to go by, maybe there's increasing interest in getting this right.

Selgin on kaleidics

"According to Shackle, the future is unknowable and 'kaleidic' (that is, dominated by patternless changes)"

George Selgin

I travelled to Madrid recently and caught up on some reading about Austrian school methodology. One article that particularly stood out was George Selgin's "Praxeology and understanding: An analysis of the controversy in Austrian Economics" (published in 1988 in the Review of Austrian Economics, and subsequently turned into a short book). I absolutely loved Selgin's defense of praxeology: (p.42)

Indeed. The challenging part though was Selgin's warning to "kaleidic" economists:

it is utterly contradictory for upholders of the doctrine that the future is kaleidic to involve themselves in theoretical doscussions, especially when such discussion refer to institutions such as banks of money or to classes of events such as the trade cycle or inflation (p.48)

Selgin's basic point is that praxeology beats kaleidics, and if you have to "temper" kaleidics to retain praxeology, it's no better than mere historicism. Those of us who adhere to Mises' distinction between theory and history; who favour explanation over prediction; and look for pattern changes rather than single point estimates; are thus not truly "kaleidic" economists. OK, fair enough. But there may still be an advantage to getting as close to radical subjectivism as one can get without falling down the black hole of nihilism. The world probably isn't kaleidic, but it may well be more kaleidic than the vast majority of economists are wont to admit. And at important moments it can appear kaleidic. Shackle may be presenting a view - something we can incorporate, without having to fully adopt. After all a kaleidiscope isn't "patternless". It's just highly complex, prone to unanticipated readjustment, and this impossible to forecast. According to Richard Wagner a "kaleidic" view of economists is simply one that takes time seriously, and sees turbulence as the "unavoidable incompleteness of intertemporarl coordinaiton". Yes!

Beckworth on the ECB and the crisis

The main purpose of this post is to promote David Beckworth's recent paper, The Monetary Policy Origins of the Eurozone Crisis. He presents a "standard view" of the crisis: a 2008 financial panic, which originated in the US, spread to the Eurozone causing a recession. In fact, he plausibly argues the monetary policy errors by the ECB caused an economic slowdown, which then caused the sovereign debt crisis. I recommend the whole article. He says,

This paper has argued that the ECB’s tightening of monetary policy in 2008 and again in 2010– 2011 caused the Eurozone economic crisis...

The ECB’s big mistake was in responding to these changes in inflation as if they were symptoms of a demand shock when, in fact, they were symptoms of a supply shock.

I totally agree that ECB policy decisions played an important causal role in the Eurozone crisis, and I endorse the conclusion that an NGDP level target target would work better. 

My only gripe is that I believe the lions share of the blame should be placed on the monetary regime that they were following (i.e. inflation targeting), rather than the decisions being made within that regime. In other words I don't think that the ECB are really to blame.

It's true that within an inflation targeting regime, policy makers have discretion to "see through" obvious supply shocks. The Bank of England "saw through" a very long period of above target inflation from 2010-2013. But there's two crucial point of difference between the ECB and other central banks, which constrains its actions.

One is that it doesn't have the ability to buy sovereign debt from the Eurozone as a whole. The reason for the ECB's slow uptake of QE is primarily due to the political implications of choosing what portfolio of sovereign debt to buy. It's signficantly easier for the US, UK, Japan etc. So to some extent the ECB had its hands tied in terms of the tools at its disposal.

But the second crucial point of difference, and more relevant to the 2008 and 2010/11 decisions to raise interest rates, is the fact that the ECB is a new institution with an explicit inflation-only mandate (i.e. its target). In particular, the ECB was tasked with keeping inflation below 2%. For most of its early years, this was reasonably successful. In May 2001 inflation hit 3.1% (and interestingly they decided to see through it, so maybe my point is totally facile), but aside from that single month inflation was under 3% from their creation right up until November 2007. By July 2008 it has reached 4.1%, which is double the upper threshold of its target. So this is the first real test of the strength of independance. A decade of suspicion that the ECB would cave in to political considerations for easy money was now under scrutiny. They cannot refer to unemployment as part of any dual mandate, because they only have a single mandate. Saying that they will see through inflation is akin to saying they don't see it as a problem. I can understand why they raised rates because in a "One Target One Tool" framework that's what you do when inflation is high. Especially when you're trying to create a reputation for being inflation hawks.

The US is a great counterexample. Whilst Bernanke cashed in the Fed's credibility by appearing at joint press conferences with Paulson (and doing so much that he could be accused of making matters worse), the ECB did too little. But they didn't have the option of a joint press conference with a Eurozone Minister of Finance, and if they'd ignored their inflation-fighting mandate they'd have jeapordised their raison d'etre.

When David promoted his paper on Twitter, he said

Imagine ECB eased in 2008 & 2011 instead of tightening and did QE earlier. If so, would Brexit be a thing?

I glibly replied,

if ECB totally disregarded its mandate and opted against building credibility would *it* be a thing?

I believe that if they had eased it would have cast serious doubt on the ECB's independence. The impact of their decision was terrible, but I understand why they made it. Indeed if the lesson is that they should have exercised more discretion the implication is that we need different people in charge. On the contrary, we need a different regime. The ECB failed because they were set up to fail.

P.S. I've been listening recently to David's podcast "Macro Musings" - it is really good. I enjoy Econ Talk but when they're over an hour long I struggle to get through them quickly enough. And because I can't be bothered to spend time identiying the ones I have an interest in I've actually stopped listening. By specialising on monetary economics I know that I will want to listen to each new episode of Macro Musings, and it's quickly become a favourite podcast. It's a brilliant substitute for a faculty lounge for those of us outside academic econ departments, but David ensures that key terms are defined and content is provided so non academics can get a lot out of it. I can't recommend it highly enough.

P.P.S. I can't believe my last two posts have been criticising Lars and David, and defending Carney and the ECB. It's been a long academic year and I clearly need some rest!

Brexit, regime uncertainty, and monetary policy

In light of Brexit, Lars Christensen has called on Mark Carney to adopt a 4% NGDP target. In doing so, he has argued that the result of the vote has increased regime uncertainty, which constitutes a negative supply shock. I disagree.

In a previous post Lars criticised the concept of regime uncertainty on the grounds that it was too Keynesian:

Higgs’ description is – believe it or not – fundamentally Keynesian in its character (no offence meant Bob): An increase in regime uncertainty reduces investments and that directly reduces real GDP. This is exactly similar to how the fiscal multiplier works in a traditional Keynesian model.

I don't see the problem. For me, an advantage of regime uncertainty is that it puts flesh on the bones of Keynes' "animal spirits". Rather than waving your hands and talking about the confidence fairy, regime uncertainty offers a clear mechanism to show how policy announcements can impact the economy. And that impact is not damaging the potential growth rate per se, but altering the immediate spending decisions of market participants. The two concepts are closely related - regime uncertainty will undoubtedly cause potential growth to fall. But in the first instance regime uncertainty affects aggregate demand.

Another way of putting this is that in the equation of exchange, MV=PY, there are two types of aggregate demand shock. Either the money supply can change (i.e. M), or "velocity". Technically, the definition of velocity is anything that affects PY holding M constant. Practically, this means shocks to spending that aren't brought about by changes in the money supply. In other words, they are changes in the demand to hold money.

My claim is that we don't need to alter what Higgs means by regime uncertainty to preserve a monetarist framework.

In a separate post, Lars says that,

First of all, it is clear that Brexit has caused an increase in particular demand for US dollar and other safe assets. This is essentially a precautionary increase in money demand and for a given money base this [is] a passive tightening of monetary conditions.

Secondly in my view, more importantly, the increase in regime uncertainty should basically be seen as a drop in the expected trend growth rate in both the UK and the euro zone. This means that we should expect the natural interest rate to drop both in the UK and in the euro zone and maybe even globally.

I don't believe there's a need to combine these two valid points.

I agree that the surprise referendum result has generated uncertainty about the future institutional structure of the UK. And it is not just economic uncertainty, it is policy uncertainty. In fact, it's not just policy uncertainty, it's bona fide regime uncertainty. Lars' first point is that regime uncertainty, and the typical response to uncertainty - hoarding cash, buying gold - constitute an increase in the demand for money. This means that V has fallen, and this ceteris parabus so has (MV). I agree with this, but view it is a negative AD shock.

This regime uncertainty is likely to lead to lower growth prospects, but there are many things that affect future growth other than regime uncertainty. Indeed there's widespread certainty that regardless of the type of deal the UK get, and who the Prime Minister will be to negotiate it, Brexit will be economically damaging. Our future productive capacity has been dented by reduced economic cooperation with the EU. Thus Lars' second point that expected trend growth has collapsed is also true. But I don't see this as part and parcel of regime uncertainty. I see it as a separate shock.

The fact that sterling has weakened doesn't demonstrate that regime uncertainty is a negative supply shock, it just suggests that the negative supply shock has thus far dominated the negative demand shock. And I would give credit to Mark Carney for minimising the impact of regime uncertainty - he has calmly and credibly signalled that interest rates are more likely to be cut rather than increased. He hasn't said "a negative supply shock will put upward pressure on inflation and we will carefully monitor inflation expectations to ensure they remain anchored". Rather, he's said "we won't let AD contract". Perhaps he is a closet NGDP targeter after all!

Whilst I'd like to see the Bank of England adopt an NGDP target, unfortunately I don't see the present environment as being especially fertile. And crucially the reason is that inflation is currently well below target. If inflation was on target then whether Brexit constitutes a supply shock or a demand shock would matter because an NGDP target would imply a different policy response to an inflation target. For example, if inflation were currently 2% then a negative supply shock would cause an inflation targeting central banker to tighten policy.But an NGDP targeter would see no reason to change the policy stance. Thus a closet NGDP targeter might be tempted to jump ship. But inflation is 0.3%, and the Bank of England have plenty of room to permit supply shocks to manifest themselves without tightening. The regime doesn't really matter right now.

Finally, Lars says "In a Market Monetarist set-up this [a Keynesian view of regime uncertainty] will only have impact if the monetary authorities allowed it" which is true. Fortunately, however, Carney seems willing to offset regime uncertainty.

Brexit shows the value of scenarios

When the result of the UK referendum on exiting the EU (Brexit) was announced, the FTSE 100 immediately fell by 8.7% and sterling fell around 8% relative to the dollar, and down 5% against the Euro. Clearly, markets were surprised. But why? Even though opinion polls and betting markets indicated that "Remain" would win, it was hardly like Leicester winning the Premier League. I think the problem comes down to mindset.

The debate between opinion polls and prediction markets is essentially a debate about forecast techniques. Although useful, they drive attention to narrow outcomes. Billions of pounds were clearly hinging on a a few percentage points spread. This implies that in future we need better quality opinion polls and better functioning prediction markets, and lots of money can be made from better probability values.

However I'm pleased that the failure of forecasting has generated increased attention and utilisation of the scenario method. A scenario planner doesn't care what the probability of Brexit is. We simply didn't know. What we did know, was that one of two possible outcomes could happen - a Leave vote, or Remain. Therefore plans should be made around both. As an economist, I was routinely asked in the buld up to the vote "do you think we'll leave?" This is based on a forecasting mindset. I tried to say "I don't know", but it's hard not to weigh in with a (flawed) prediction. The better question would be "what should we do if we leave, and what should we do if we remain?"

Now that the result is in, the uncertainty is not over. The manner in which Brexit will occur, if at all, is the topic for discussion. And thus far no one has asked me "what do you think the most likely arrangement will be?" At heightened uncertainty, you only really have scenarios. Hence newspapers are discussing "The Norway option" or "Article 50 isn't triggered" or "Scotland has another referendum". Scenarios are the go to framework.

I don't meen to disaparage polls or markets. Both tell us different things, and are useful. But it's clear that too much money was riding on their predictive power, and we should be humbled by that. I am encouraged that people are thinking in terms of scenarios, and hope the economics professsion does the same.

Hayek and Friedman in Chile

I gave a talk last night on the role of economist as public policy advisor. In particular, I was interested in challenging the prevelent conspiracy theory that economic crises lead to neoliberal policies, which lead to bad outcomes.

I think this theory rests on two important pieces of ignorance about economics. The first is the conflation of neoclassicism (a method) and neoliberalism (an ideology). I explain more in this IEA blog post. The main point:

To the extent that ‘neoliberalism’ has come to dominate western policy making, it isn’t liberal. To the extent that ‘neoliberalism’ is extreme free market dogma, it’s of negligible impact.

The second area of ignorance is Public Choice theory. I argued that treating neoliberalism as being synonymous with corporatism simply ignores what "neoliberals" actually believe - we don't think that unemployment is due to individual weakness, but to instutitional barriers such as labour markets rigidities and occupational licensing. In other words "we" have a very clear theory of regulatory capture and crony capitalism. 

Notice that I am claiming the term "neoliberal". Indeed this brings us to Friedman and Hayek in Chile, because if this is an example of neoliberal intervention it is worth pondering what happened and challenge whether it's the smoking gun that critics to often claim. After documenting the role of Friedman and Hayek, I mentioned a great paper by Bob Lawson and J.R. Clark. They make the following definitions:

  •  

    • Economic freedom – 0.5 standard deviations higher than average on the Economic Freedom Index
    • Political freedom – 1 standard deviation higher than average on the Freedom House Index (and average of “political rights” and “civil liberties”)
  •  

This produces a 2x2 matrix where we can not only assign countries to various quadrants, but also map how they move between quadrants over time. I used this as a basis for "The Economic Freedom Parlour game" and it seemed to go down well.

According to Hayek and Friedman, you can’t have political freedom without economic freedom, which implies that quadrant B is unstable. According to Lawson & Clark's data, less than 10% of the data set is contained in quadrant B. In 1980, for example, there were 12 cases, and typically these were "high income Western nations who were in the final stages of their most socialist periods”. The fact that 11 of them (with the exception of Venezuela) subsequently becamer more economically free (B->A) seems to support their thesis.

We can also bring in the Road to Serfdom, where Hayek claims that when democratic socialism fails planners will move toward totalitarianism (i.e. B ->D). If we consider this to be a prediction (i.e. that it will necessarily happen) it looks to have been refuted. 11 of the 12 avoided that path. But if we consider it to be a warning, the sole example of Venezuela is validation. In other words, those European countries didn’t let the planners continue their planning, and neoliberalism saved the day.

According to Lawson and Clark the key findings are as follows:

  1. Chile's drastic increase in economic freedom was soon followed by increases in political freedom
  2. Israel's lack of political freedom in the 1970s/1980s didn't last, and relatively free-market policies have coincided with a steady increase in political freedom
  3. Venezuela really began to lose economic freedom from 1990-1995 and since then political freedom has fallen (and is falling).

This latter case - Venezuela - is the Road to Serfdom before our eyes. And I think the framework is a very interesting one to think about the dynamics of transition. Should we focus on moving from D -> B and hope that political freedom begets economics freedom (and run the risk of lapsing into the Road to Serfdom?); or should we aim for D -> C and risk getting "stuck" in an authoritarian but prosperous country like Hong Kong or Singapore. To help with this, I presented some of the key findings from my 2009 book on neoliberalism in Eastern Europe, and also shared Anders Aslund's point that it may be a false choice. The tradeoff may not be D -> C or D -> B but between D -> Cor nothing. After all,

  1.  

    “Market economic reforms have been highly successful, whereas democratisation has only been partially auspicious, and the introduction of the rule of law even less so” (2007, p.305)

    “At present, we seem to understand how to build a market economy, whereas the ignorance of democracy building and the construction of a legal system are all the more striking” (2007, p.311)


For me, Eastern Europe is an example of the success of neoliberalism. However the success could have been greater still.

The left falsely identify Friedman (rather than Hayek) as leader of the neoliberal revolution because they can pin more on him. But it’s Friedman’s neoclassicism (i.e. method) that dominated the economic and public policy debate, not his neoliberalism (ideology). We need more of it. 


The Upper Turning Point

In 1979 Jeff Hummel published an important critique of Austrian business cycle theory. I'm biased, but I felt it's received insufficient attention amongst Austrians. Especially in terms of the unsustainability of the boom - how inevitable is the upper turning point?

I think that many Austrians take it as a given that at some point an increase in the money supply will begin to accelerate, couched under the claim that "X is necessary for the boom to continue". But what about if you don't want a boom to continue? What if, after a boom, you just want a soft landing? Can you avoid a recession? At this point my inner Austrian resorts to hand waiving and saying things like "structure of production" and "relative price effects". But I also find it interesting how many explanations revert to political economy claims.

I thought a good way to approach this issue would be to present the ABC textbook style, side-by-side with alternative explanations. David Romer uses illustrative path dynamics, and Mishkin's textbook analysis presents the following scenarios for monetary expansion:

In 2013 I wrote up a working paper and have decided to release it now as a special report.

Must an increase in the money supply lead to an increase in the growth rate of the money supply? According to Hayek (1934) this would be necessary to sustain the boom, and this is true. But what if you don’t want to sustain the boom? What if you want the structure of production to be maintained at its existing level?

I point to "capital heterogeneity" effects and the Ricardo effect as distinctly Austrian explanations. However the literature review is incomplete and there are some serious flaws and problems.

The main reason for not taking it any further is that back in 2013 I became aware of a working paper by Larry White and George Selgin, on the same topic. Their stylised paths of money paths of the money stock, nominal interest rate, and real interest, approximated what I felt had been missing in the Austrian literature. And, interestingly, they suggest that a slowdown in the growth of money supply is not a necessary turning point. In fact, they criticise Hayek (and others) for the same reasons Hummel does, as far as I can tell. Their article is called "The Austrian Theory of the Business Cycle in a Fiat Money Regime" and I look forward to reading it in print.

UK economic update - June 2016

I spent this morning populating the monetary dashboard, and thought I'd write up why my current view of the UK economy is "meh".

Monetary growth is reasonably strong and consistent. M3 has fallen from 2.7% to 2.3% and M4ex has fallen from 4.8% to 4.2% but narrower measures have grown - MAex is 7.8% (from 7.3%) and household Divisia 8.9% (up from 7.4%). Inflation measures remain subdued - CPI has fallen from 0.5% to 0.3%, RPI is down from 1.6% to 1.3%, input prices are -0.7% and output prices -6.5%. From a monetarist perspective there's no sign of impending return to the inflation target - indeed inflation expectations over the coming year have fallen from 2% to 1.8% and the Fed 5 yr be rate is 1.45%. We are still a long way from "normal" inflation.

It's important to take a broader look at inflationary pressure, but the picture doesn't change. Although the House Price Index jumped from 7.6% to 9% last month the Nationwide measure fell to 4.7% and Halifax remains elevated at 9.2%. IMF's measure of commodity prices is 4.7%. Stock market indicators are up over the last 3 months but the FTSE 100 is down 7.6% since last year. NGDP grows at a modest 2.5% and altough the PMI index has risen (slightly) above 50, Industrial Production is down 0.3% and business investment fell by 0.5%

The unemployment rate is 5.1% and the ratio between vacancies and unemployment for Jan-Mar at 0.45. Average Weekly Earnings have risen slightly, but are under 2%. The HM Treasury survey of forecasts shows that growth of 2.1% is expected next year, and inflation of 1.9%. Interest rates have fallen slightly, sterling is down, yields are down. With so much uncertainty due to the possibility of Brexit it would be wise to be cautious. And with inflation so low, policymakers hands are pretty tied.

Beware of misleading headlines

Firstly, I wanted to provide some warranted coverage of a letter cosigned by 280 economists (at the time of writing) on the economic impact of Brexit. Here is the text of the letter:

Focusing entirely on the economics, we consider that it would be a major mistake for the UK to leave the European Union.Leaving would entail significant long-term costs.
The size of these costs would depend on the amount of control the UK chooses to exercise over such matters as free movement of labour, and the associated penalty it would pay in terms of access to the single market. The numbers calculated by the LSE’s Centre for Economic Performance, the OECD and the Treasury describe a plausible range for the scale of these costs.

The uncertainty over precisely what kind of relationship the UK would find itself in with the EU and the rest of the world would also weigh heavily for many years. In addition, there is a sizeable risk of a short-term shock to confidence if we were to see a Leave vote on June 23rd. The Bank of England has signalled this concern clearly, and we share it.

Although I don't feel sufficiently familiar with the studies mentioned to add my own name, I respect and admire those who have done so. This is a serious and authoritative statement that is helpful to voters who want to understand the economic arguments (although I'm not sure we can ever focus "only" on the economics without having a very narrow, technical and unhelpful definition of what constitutes economics).

Recently The Telegraph published an article by Tony Yates, one of the organisers of the letter. Unfortunately, I think the article gives a misleading account of the scale of consensus amongst the economics profession.

When I raised this on Twitter Tony said that I'd misunderstood the article, which was split into two parts. The first part was about whether economists should be listened to generally; the second on the specific issue raised by the letter. But I was confused. If the main point was "there isn't a lot that economists agree upon so when they do, it's worth paying attention" I'd be in full agreement. But if this were the case, he'd have identified the range of issues where the cosigners disagree. Instead, Tony says they differ on a somewhat vague "Was the Coalition austerity policy right?", but previously in the article he says that:

Compare the Great Depression to the financial crisis. In the US, output fell by 30pc to its trough. Following 2008, it fell by 4pc. A lot of factors are at work here. But part of it was about lessons we have learnt in macroeconomics. 

For example, we understand better why a fiscal stimulus works and when it’s beneficial. The support for this in the economics community helped bring about the US fiscal stimulus package of 2009.

It isn't clear to me whether Tony is saying that (i) there are some topics where economists have a consensus, and can therefore give good policy advice (and fiscal stimulus and the economics of Brexit are two of those areas); or (ii) disagreements between the cosigners on fiscal stimulus is all the more reason to take seriously their agreement on Brexit. Who were the cosigners who believed that the US fiscal stimulus backfired? Which ones thought UK austerity was a myth and cuts should have been deeper? Also, if he wanted to pick a topic on which there was genuinely a consensus among the profession then why didn't he choose free trade? Indeed that would be much more relevent in the context of a vote to leave a free trade area.

Furthermore, whether he's using "we" to refer to economists, or the cosigners, isn't helped by The Telegraph's editing team. Consider the final paragraph:

It is very clear that the "disorderly, fractious and argumentative" group that Tony is referring to is the cosigners of the letter. Indeed this is also clear from the URL of the article:

 However the headline conveniently drops the word "these":

The headline reads as if Tony is referring to all economists. In fact, he's claiming that he's only referring to a group of 280. I've written plenty of op eds and am used to editors using a slightly misleading headline in order to generate a response. But usually I'd say "I didn't write the headline!" I don't think Tony wrote the headline, but I'm surprised that he's not willing to distance himself from it. If 280 economists agree on something policy relevent then it is worth reporting. But if it's reported in a way that implies consensus within the entire profession, this actually reduces the quality of public debate.

Special report on predicting the financial crisis

Kaleidic Economics have released a report on the track record of the Austrian school in regards to predicting the 2008 financial crisis. It argues:

Although economic science is not well equipped to make predictions, it is a myth to claim that “no one” saw the financial crisis coming – the economic events that we have experienced were possible to navigate

To navigate an array of contesting claims, the main criteria used were as follows:

  1. Documented evidence must exist
  2. Studies must be right for the right reasons
  3. It has to be timely
  4. Put their money where their mouth was

There's even an appendix where I outline my own personal forecasts. Download the report here.

The policymakers view of the great recession - a dynamic AD-AS analysis

I am a big fan of Tyler Cowen and Alex Tabarrok's "Dynamic AD-AS model". I introduce it to around 400 people a year. If you're not familiar with it, I advise you to read their excellent principles textbook. I also have a youtube video, and a presentation.

The main difference with the standard AD-AS model is as follows:

  • Instead of showing the price level and real GDP on the two axes, it shows inflation and real GDP growth

  • A Solow curve instead of a Long Run Aggregate Supply (LRAS) curve

  • An Aggregate Demand (AD) curve based on the (dynamic form of the) equation of exchange instead of Pigou's wealth effect, Keynes's interest-rate effect, and Mundell-Fleming's exchange-rate effect

  • A Short Run Aggregate Supply curve (SRAS) based on the signal extraction problem rather than labour markets

Lars Christensen (2013) has utilised the dynamic AD-AS model to provide an explanation of the Turkish demonstrations. My quibbles with his account would be (1) he argues that demonstrations will cause temporary disruption to production, and models this as a negative shock to SRAS. I would claim this is a negative shock to the Solow curve. (2) He argues that regime uncertainty will damage the potential growth rate of the economy, and models this as a negative Solow shock. I would argue that this is a secondary shock, and that the primary effect of regime uncertainty would be a negative AD shock.

In this post I just want to present a very simple “policymaker” view of the great recession. This involves a comparison of two time periods: Q1 of 2008 and Q2 of 2009. In 2008 AD is growing at 5.5%, which is split between 3% inflation and 2.4% real GDP growth. We can assume that in early 2008 the economy is healthy, and on the Solow curve. Then, by the second quarter of 2009 a series of problems have affected the economy. These include the collapse of the US subprime industry, massive declines in global confidence, and negative wealth effects. Students are asked to summarise these events, and should identify them as negative AD shocks (in other words NGDP was allowed to contract). This implies that inflation and real GDP should fall, and this can be corroborated with the actual data. Figure 1 shows the “solution”.

2008 Q1 – 2009 Q2

2008 Q1 – 2009 Q2

This can generate a discussion about appropriate policy responses, and students will probably mention monetary easing or fiscal stimulus as means to boost AD. Indeed in 2011 Q1 inflation was back at 3%, real GDP growth was 2.1%, and so the economy was close to returning to the original position and avoided the “laissez-faire” outcome of substantial deflation and a SRAS that shifts downwards.[1] Policymakers might indeed argue that successful (albeit belated) injections of demand worked.

However this would be too simplistic. There are plenty of other important shocks that could be incorporated, and inflation has generally been much higher than a negative AD shock would suggest.[2] More importantly, a lot of the story is lost if we start in 2008. It is telling that in Scott Sumner’s attempt to use the dynamic AD-AS model to explain the US recession he starts in July 2008 (Sumner 2009). This captures a key difference between Austrian and monetarist analysis. As Garrison (2001) has said,

“did the collapse occur (a) in the midst of a period of healthy growth because of sheer ineptness of the central bank or (b) near the end of a policy-induced boom that was unsustainable in any event and in the midst of confusion about just what the problem was and how best to deal with it?”

We need to start the analysis before the crisis, in case it was indeed an unsustainable boom. But we also need to allow for the possibility that central bank ineptness makes things even worse. I've done just that in a longer article, published by the Journal of Private Enterprise.

[1] Absent further shocks if AD remained at -3.9% then once inflation expectations fully adjust the implied rate of inflation would be -6.3% (i.e. this is where the AD curve intersects the Solow curve).

[2] This implies something has also affected the Solow curve, and so we need to use the dynamic AD-AS model to unpick this.