The "productivity norm" is the assertion that prices should be allowed to vary depending on changes to the unit cost of production. In quantity theory terms it says that permanent technology shocks that alter real output should be permitted to manifest themselves in inflation. Under inflation targeting, this doesn't happen. Central banks attempt to alter aggregate demand such that P is stable. A productivity norm ensure that supply shocks affect P, but demand shocks do not. This is because aggregate demand (ie MV) is stable. This is similar to advocating an NGDP target of 0%.
In March last year I tried to replicate the chart below, from George Selgin's "Less than Zero":

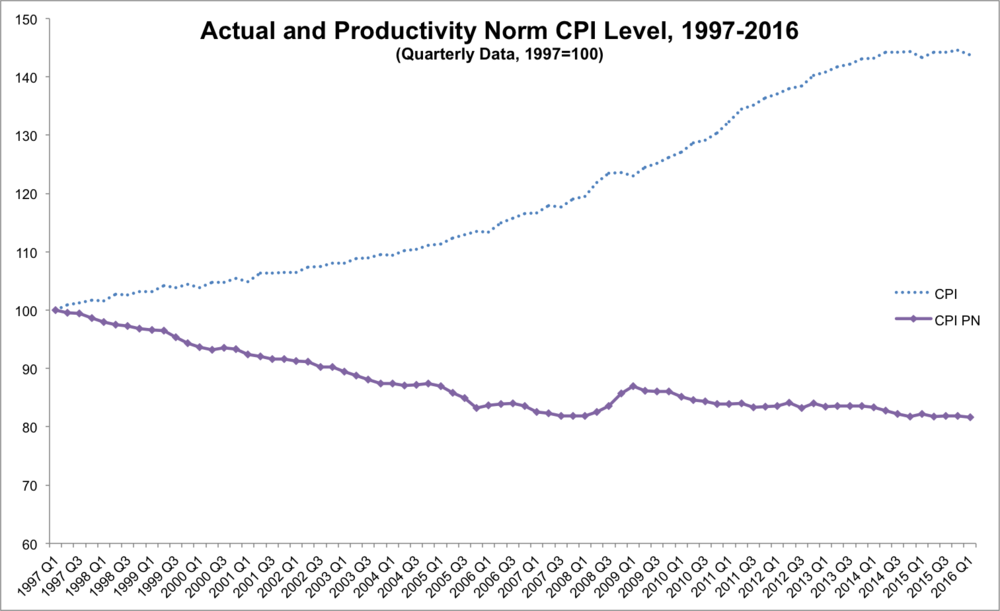
I'm not sure why the link is dead, but I thought I would try again, and appreciate help from George (although the usual disclaimer applies). Using CPI data (series code D7BT) and labour productivity (A4YM) and rebasing to 1997, I came up with the following:
I used the following formula:
![]()
Ideally, one would use Total Factor Productivity but there's only an annual estimate in the UK. The most recent version was released in May, and covers 2014. Using that data, we can see the following:
 This tells an interesting story - it suggests that a productivity norm would have permitted a mild deflation in the years prior to the financial crisis, as the UK economy enjoyed productivity improvements. I tend to view the 2008 inflation shock as being the Ricardo effect, and of course it was the coincidence of an jump in prices right when the economy was entering recession that caused central banks to permit a secondary recession. If they had been following a productivity norm then they'd have allowed inflation to raise even higher.
I wanted to have a regular series, and so I've used the quarterly growth figures for labour productivity to will regularly update the data section. It remains a work in progress.
