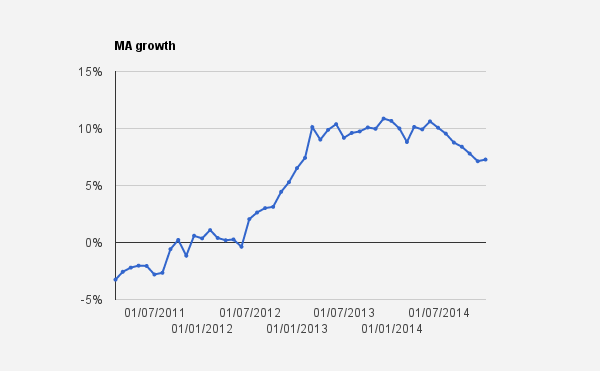
Following recent falls in the growth rate of MAex, December 2014 figures show that it has risen slightly to 7.28%.
 Update: There was an error with the chart presented in the previous version of this post.
Your Custom Text Here
Following recent falls in the growth rate of MAex, December 2014 figures show that it has risen slightly to 7.28%.
Update: There was an error with the chart presented in the previous version of this post.
February 26th will see the publication of the Second Estimate of the UK National Accounts, which will include our first look at the NGDP figures for Q4 2014.
For a link to the question at Inkling Markets, see here.
The actual NGDP growth rate was 3.8%. Here's how it has looked over the last few years:

Here is our new prediction market:
I've just stumbled across the BIS' Effective Exchange Rate Index:

I've always found it difficult to get hold of a regularly updated effectice exchange rate index, and ideally would have a real one (the BIS one is nominal). Any suggestions?
In November 2014 the growth rate of MA(ex) fell to 6.96%, down from 7.76% in October. This still represents a strong growth rate since a strong burst from -0.37% in May 2012 to +10.12% in February 2013.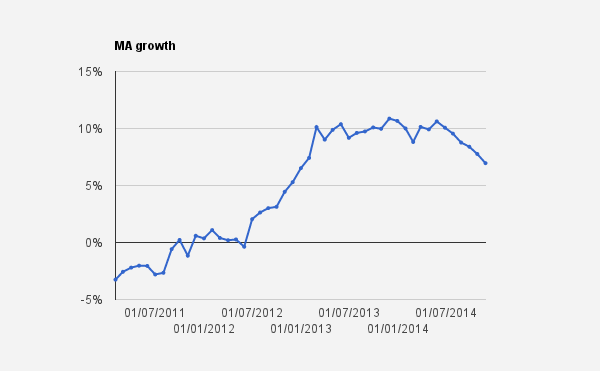
Also, the Bank of England's A1.1.1 "Notes and coin and reserve balances" doesn't contain the growth rate of the total monetary base (i.e. Notes and Coin + Reserves), but here it is:

October 31st saw the belated release of the 2014 Input-Output Supply and Use Data. This is important because it incorporates a larger amount of economic activity than GDP data, but comes at the cost of only appearing as an annual series, and with an 18 month (or longer) lag. The diagram below shows the breakdown of the measure for 1997:

I've previously mentioned that Gross Output data is now an official BEA statistic, and I am interested in seeing equivelent figures for the UK. Here they are.
Firstly, in terms of absolute numbers, we can see that Total Output dwarfs Nominal GDP.
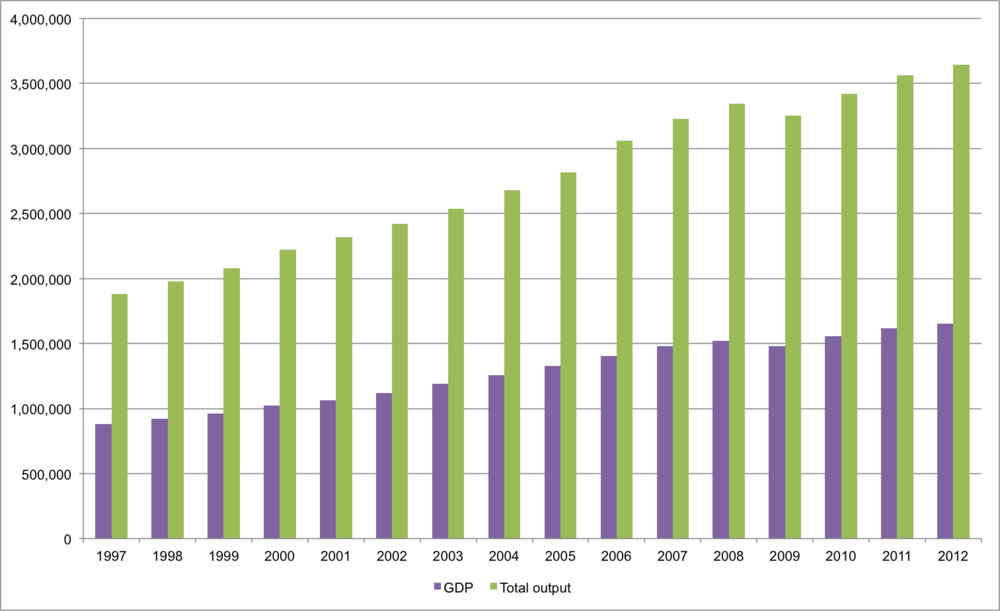
In fact Total Output is around twice as large as Nominal GDP:
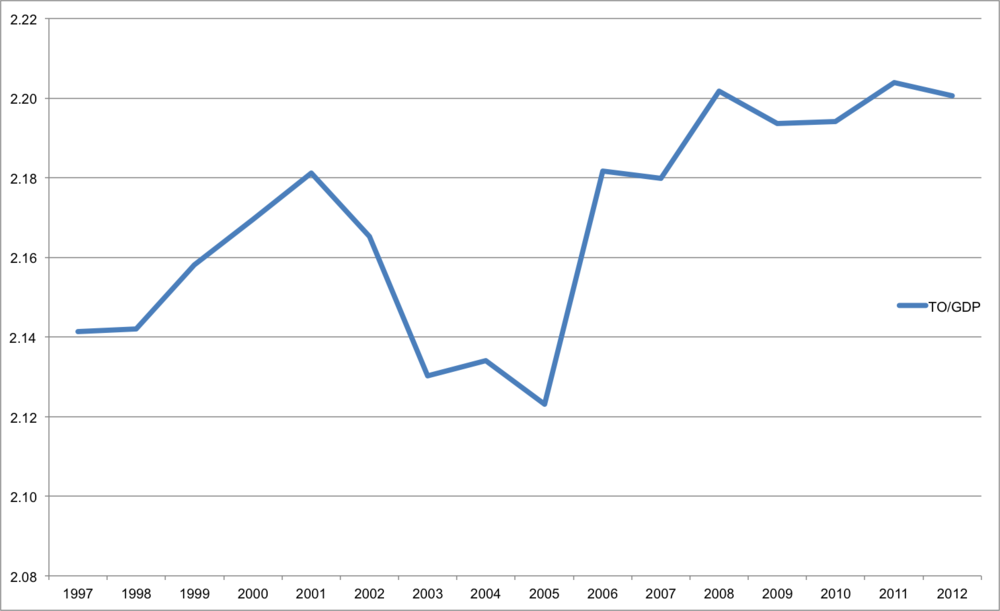
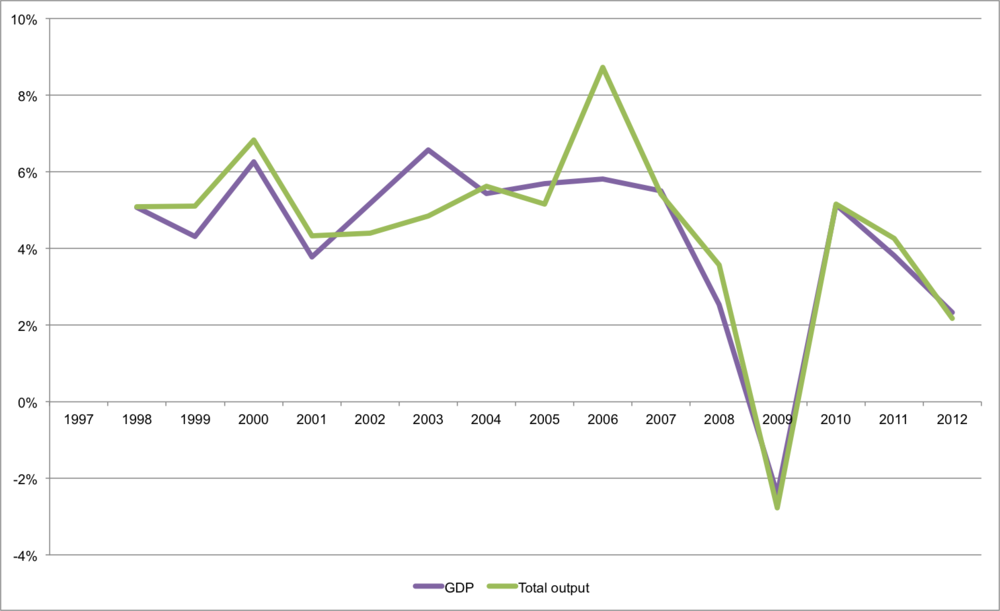
The reduction in the ratio that occured in 2002-2005 is a result of Nominal GDP growth running ahead of Total Output growth. But notice the dramatic increase in the ratio in 2006. This was because Nominal GDP was growing at 5.81%, whilst Total Output grew at 8.73%. This reveals that economic activity was running at a significantly higher pace than a focus on GDP data was telling us:
One of the main reasons why the September revisions to GDP had such an impact was because of a reclassification of R&D spending. This rests on a conceptual problem with distinguishing between investment and intermediate consumption. As more and more economic activity becomes service based we might expect this problem to grow over time. One of the chief benefits of using a broader measure of national income is that it captures all intermediate consumption, and therefore the boundary between intermediate and final consumption/investment becomes less relevent.
These figures reveal that in 2010 and 2011 the wider economy was growing at a higher rate than that being measured by GDP, and in 2012 they were effectively the same. It is very difficult to read much into these annual growth rates, given that there is likely to be a lot of quarterly volatility. But in the same way that the US have started releasing this as a quarterly series, there would be much to gain from the ONS doing likewise.
We are delighted to publish an extensive overview of the current state of the UK economy. You can download a free PDF here, or see a powerpoint version below. The report was compiled for the October meeting of the Shadow Monetary Policy Committee, and includes background data as well as a more detailed look at impending threats from the Eurozone and China.
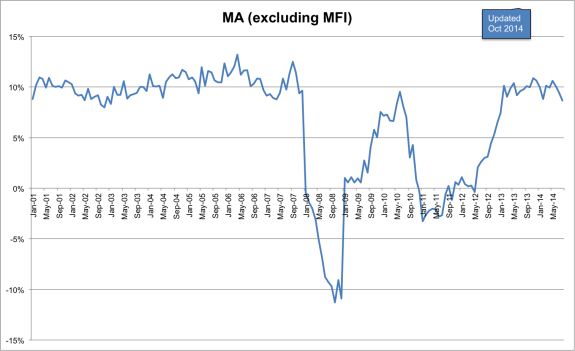
MAex shows continued growth of around 9%, using updated figures. It has now been within a band of 8.7% - 10.9% since February 2013.
I'm in the process of writing a guide to UK monetary policy, and thought I'd take a look at the material the Bank provide for participants of their Target 2.0 competition. In it's explanation of the cause of inflation, it says,
But what happens if there is an increase in demand for some reason, for example due to a reduction in income tax, or because consumers suddenly feel more optimistic and start spending more money rather than saving?
• Consumers’ expenditure – spending on goods and services by households in the United Kingdom;
• Capital expenditure – investment in buildings and new equipment;
• Expenditure on stocks of goods – spending by firms on increasing their inventories of goods and materials;
• Government expenditure – spending by central and local government on health, education and other public services;
• Expenditure on exports – spending by foreigners on UK goods and services; and
• Expenditure on imports – spending by UK residents on foreign goods and services.
The ultimate cause of inflation can really be said to be central banks, like the Bank of England. Their behaviour and actions determine whether inflation is allowed to rise or is kept low – in other words, whether they allow prices to rise unchecked by monetary policy, or whether the central bank seeks to influence the amount of money in the economy.
But what happens if there is an increase in demand because of an increase in the money supply
The recent update to the MA compilation method revealed a sudden reduction in the growth rate. However this was driven by a mysterious "improvements in reporting at one institution", which saw £85bn vanish in January 2014. I made a shadow M' series which added this back in, but that's not ideal.
I've just tried an alternative response, which is to strip MFI deposits from the measure. We can call this MAex, and here's the series from April 1991:

If you want to see a more recent look, here it is from January 2001:
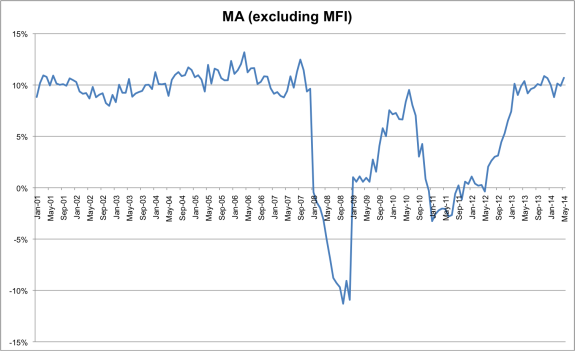
I'm continuing efforts to improve the measure.
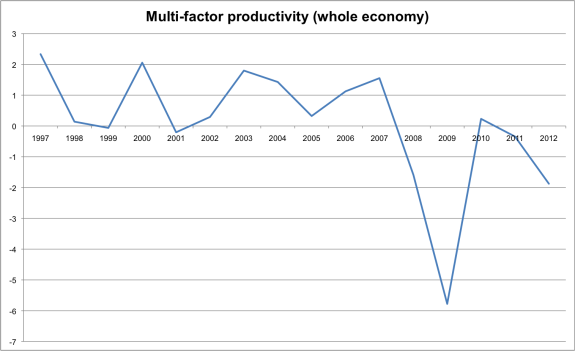
In my post on neutral interest rates I mentioned productivity figures. I wondered whether the reason the estimate of the (real) neutral interest rate of 1.8% (which is implausibly high) is a function of (i) using the wrong productivity measure; (ii) the problems with UK productivity measures. Labour market productivity is released each quarter, but ideally we want to use MFP.
The closest I've come is a January 2014 ONS estimate of MFP. It's labelled "experimental" but at least provides annual data from 1997-2012. It looks like this:
If anyone is aware of quarterly estimates, I'd be interested to know.
Having begun with such a confident headline, the rest of this post will involve a lot of backpeddling. For many economists (not just Austrians) the Wicksellian rate of interest (or "natural" or "neutral" rate) is of central importance for macroeconomic stability. In fact, one might argue that it isn't merely an indicator of the monetary stance - it is the stance.
Indeed David Beckworth and George Selgin argued this in a 2010 working paper. This morning I thought I'd attempt to make a very rough estimate of what interest rates would be in the UK - if they were at their natural rate. Their method is based on a Ramsey growth model that says that the neutral rate of interest is a function of productivity growth, population growth, and time preference. For simplicity, they focus on the component that is likely to be most volatile - productivity. Their equation for their estimate of the neutral rate is as follows:
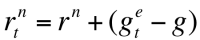 In other words, the neutral rate today is equal to the long run steady real interest rate, plus the difference between expected Total Factor Productivity Growth, and the long run average TFP growth rate.
Following them, I assume that the long run steady real interest rate is 2%. For the productivity figures I used the quarter on quarter growth rate of output per worker (series code A4Y0). I then calculated expected TFP using the following approximation of an exponentially weighted moving average:
 Again, following Beckworth and Selgin I set the coefficient at 0.7. The output is as follows:

Once I've had a think about possible errors I've made, and corrected them, I will add this to the data section of the Kaleidic website, and update it regularly. I think the chart broadly fits with intuition - fluctuation between 2%-3% prior to 2008, and then crashing into negative territory. Post crisis the rate is noticebly lower than before, with the latest estimate (Q4 2013) at 1.8%
We cannot observe the real neutral interest rate. But we do know that the long run average should roughly equal any actual long run value, and we do know something about the underlying determinants. I think Beckworth and Selgin have made an important contribution. A few discussion points to bear in mind:
One of the big warning lights in the pre 2008 boom was when broad money breached a 10% year-on-year growth rate. Since then, however the Bank of England have switched its preferred measure of M4 to M4ex. Can we use the same rules of thumb when the measure changes? I'm not sure. The chart below shows M4ex recently. One of the reasons I've not been too concerned about UK monetary aggregates is that M4ex is pretty stable, growing between 3%-5% since May 2012.

Indeed if we add the 3 month annualised growth rate (hashed line) it's risen from -0.4% in Feb 2014 to 8.4% just 2 months later (its highest rate in the series).
This morning saw the release of Eurozone M3 data, which you can see below:
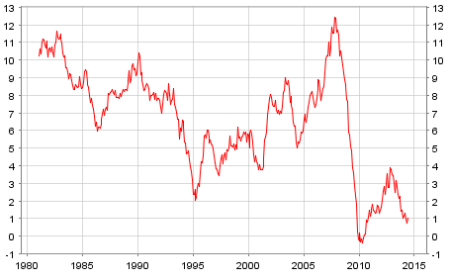 After the dramatic slowdown (note: not a contraction) that bottomed out in 2010, it's not just that the rising growth rates haven't been sustained, but have continued to fall. Looking at M3 for the UK we see the following:

The 12 month growth rate was between 2% and 4.3% from Dec 2012 through Nov 2013, but has since dropped dramatically. Despite a blip in Feb 2014 it's now actually contracting.
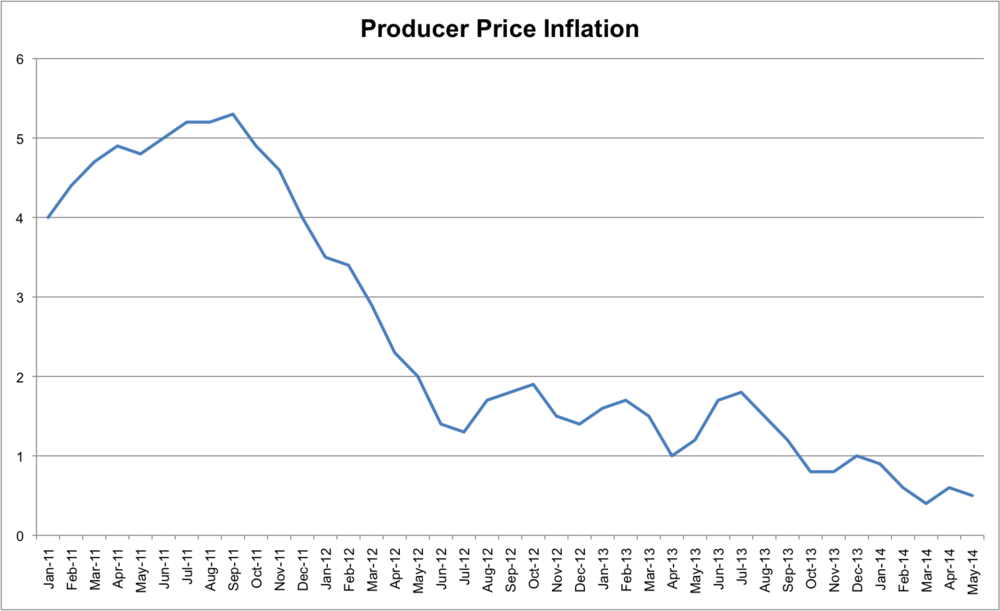
As recently mentioned, price inflation is also slowing. PPI is weak and CPI is way below target. Food for thought.
Most of the readers of this blog are UK-based non academics. But everyone interested in macroeconomics from an Austrian perspective should be aware of some fantastic new work, seeking to bridge Hayek's insights with the literature on corporate finance. In 2011 I organised a talk by Joel Stern in London - I teach Economic Value Added (EVA) in my classes, and feature it in my forthcoming textbook. But I've not sought to introduce it into my research.
One of the very best books on capital theory is Capital in Disequilibrium, by Peter Lewin. And one of the most productive members of an emerging band of youthful Austrians is Nicholas Cachanosky. So it's really exciting to see the outcome of their collaborations. In particular:
Highly recommended.
I've updated the theoretical paper that discusses how MA - our Austrian measure of the money supply - is defined and identified. You can view it here. Here is the update chart (with series breaks shown in black dots):
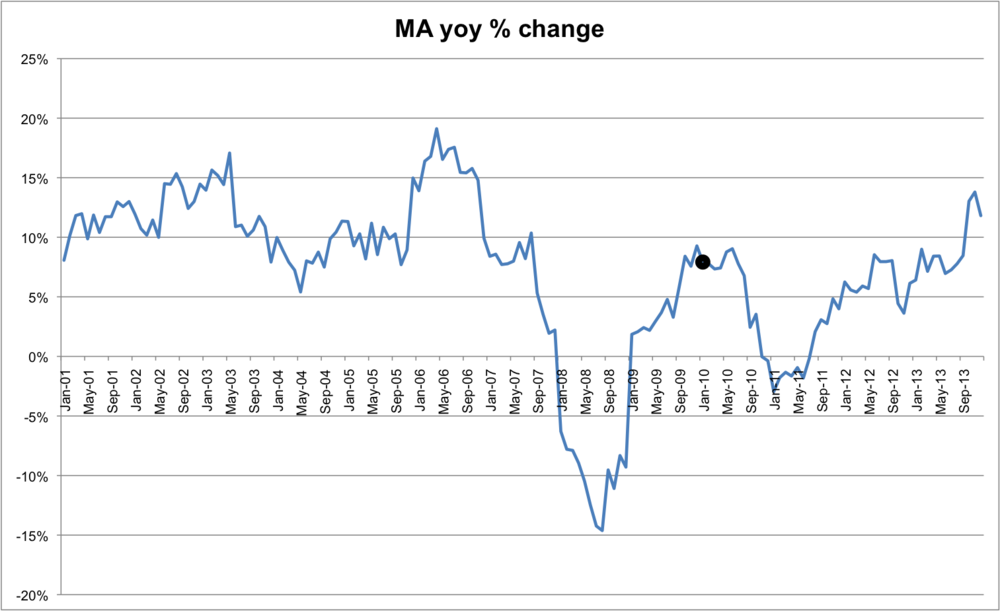
Regular updates are available at the data section of our website.

Following the 12th quarterly meeting of Kaleidic Economics, we have released a new report. The main aim of the meeting was to set out a chronology of the financial crisis, and we've suggested 5 distinct phases:
These aren't perfect, and the report offers a commentary. We then discussed a number of key shocks that occurred within these phases of the crisis, and put them in scenario analysis terms by thinking about predetermined elements and critical uncertainties. As a means to enliven the report, I have tried to explain how this type of analysis might serve as a basis for a "Choose Your Own Adventure" type account of the crisis.
This is a brief report, because much of the discussion was focused on a utilisation of the Dynamic AD-AS model. That is now a first draft as part of this project, please email me for a copy.
Some Market Monetarists have been critical of the Bank of England for being so slow to cut interest rates through 2008. I wanted to look at the GDP figures that we had at the time, to see whether recent revisions are helping our hindsight. One of the difficulties with this is that the ONS only have GDP releases going back to 2009. I was able to track down the releases, and here's what we find:

This is for the quarterly growth rate of NGDP compared to the previous year (IHYO). The green columns are what we know as of May 2014 (based on the second estimate of Q1 2014). The blue column is the second estimate of 2008 Q2, released in August 2008. The red column is the second estimate of 2008 Q3, released in November 2008. So, the post Lehman collapse in NGDP is a lot more evident now, than it was at the time.
Ideally we would be looking at the preliminary estimate, but they don't seem to be available on the ONS website. an alternative (and I appreciate the suggestion from someone at the ONS) is to look at the GDP revisions triangles. If you're not analytically minded, like me, these can look quite intimidating. What I've done is focus on GDP q-on-q growth rates of real GDP (i.e. GDP at market prices, chained volume measure).
The striking thing is the major revisions that were published in the final estimates of 2011 Q2 (released in September 2011). These were then somewhat offeset by corrections for the 2008 figures in the final estimate of 2012 Q1 (released in June 2012), and for the 2009 figures in the final estimate of 2013 Q1 (released in June 2013).
The bottom line is that early estimates of the economy in 2008 understated the problem:

Whilst early estimates of the economy in 2009 overstated the problem:
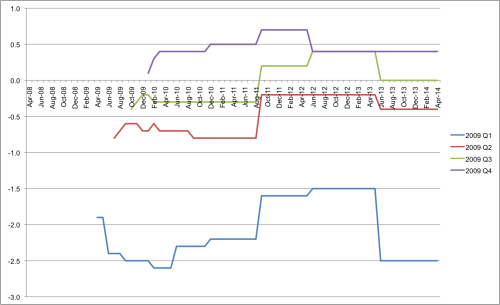
What really jumps out though, is the scale of the revisions to 2008 Q3 real GDP.
I am busy revising the paper that explains the theory behind MA, and have recently updated the measure. As the chart shows, the growth rate has tailed off significantly in recent months.
 The reason for the drop is a massive reduction UK resident MFI sterling sight deposits that occured in January 2014. Here's a closer look at that series:
 The Bank of England have the following note:
Due to improvements in reporting at one institution, the amounts outstanding decreased by £85bn. This effect has been adjusted out of the flows for January 2014.
To show the impact of this "improvement in reporting" I've created MA' which adds £85bn from January 2014. As you can see this explains the sharp fall:
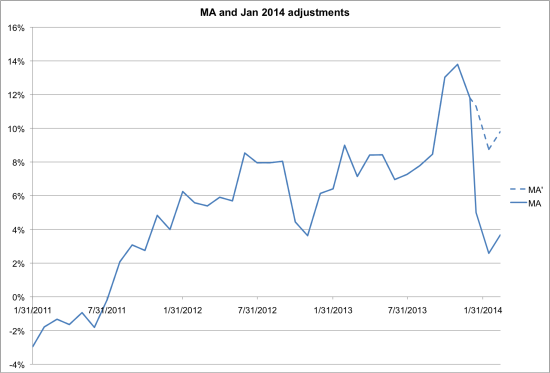
MA' remains in double digit growth. A downside of relatively narrow measures of the money supply is that they are less robust when it comes to these types of ad hoc adjustments. But clearly more details need to be revealed about the precise nature of this change.
With the overhaul of user accounts, we are proud to introduce a new feature: dashboards. As a registered user, you can now build a personal dashboard that allows you to track your favorite series and graphs. You can publicize your dashboard, so your colleagues, students or blog readers can follow the economic statistics you care about. You can create several dashboards and choose to keep them private or make them public.
Quisque iaculis facilisis lacinia. Mauris euismod pellentesque tellus sit amet mollis.