Recently I've been looking through some of the articles I've written about QE over the last few years. I spent much of the post financial crisis period learning about monetary theory and wondered about the extent to which this was reflected in my commentary. I feel that my understanding has increased significantly, and so I should reasses my previous claims.
I published several articles from 2009-2012 and benefitted from a general uncertainty that led to an increase in the demand for economic (and indeed Austrian economic) commentary. Most of the opportunities I had were not a result of my own expertise or reputation, but because I was representing a perspective that people wanted to hear. It has been an interesting intellectual journey to try to provide a mouthpiece for certain ideas, whilst also developing my own voice.
Firstly, a bit of background and motivation. I've been accused of being too academic, too theoretical. However my primary aim is to prompt debate. It is not to simulate policy. Therefore I’m very resistant to the “don’t just stand there” mentality of a crisis. If I were a policy maker my instinct would probably be closer to action. As an academic my instinct is more contemplative. I have a natural tendency to think of longer term and unseen effects, and even if these are outweighed by the short term necessity for action, I still feel I’m doing an important public duty by pointing them out. If my audience were policymakers my message may well be different. But I consider my primary audience to be the educated layperson, and therefore my primary goal to provide a perspective that they may not already possess.
As I said in 2010,
my objective isn't to impress you by how clever I am. It's to participate in a conversation about economic theory and practice that all sides can learn something from. Therefore I don't see why I need to have provide[d] an alternative plan before jumping into the debate - if I convince you that fiscal stimuli very rarely achieve their objectives, you'll need to decide for yourself what the implications are. This reminds me of students that want "an answer". I'm sorry, but that's not my job. It's to provide new information that allows you to provide your own answers. I'm not trying to convince people that my "worldview" is correct, and that you should share it. I'm merely offering fragments of wisdom to allow you to cultivate your own.
I've read through all of the articles I've cited below, and picked out the money quotes. I've then categorised them and reflected on whether I stand by them (and whether I stand by them but for different reasons). You'll have to take my word that I've surveyed them honestly, and haven't simply ignored quotes that make me look bad.
Introduction
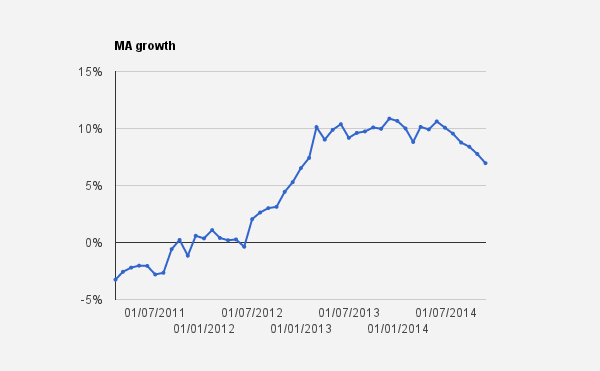
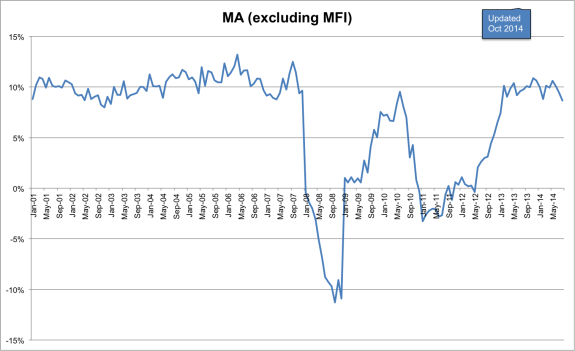
I moved back to the UK to write up my PhD dissertation in 2006. My research focus at the time was the spread of the flat tax in Eastern Europe, but it seemed clear to me that there was an impending resurgance of Austrian business cycle theory. I've written elsewhere about whether Austrians predicted the financial crisis, and that's a hard question to answer. But it seemed clear that we were experiencing a central bank induced credit bubble and that a recession was on the horizon. And yet policymakers didn't seem concerned. With Toby Baxendale I began work trying to find an Austrian measure of the money supply. By 2008 it seemed obvious that a monetary boom had preceded a monetary contraction. But at the time, official measures hadn't revealed it.
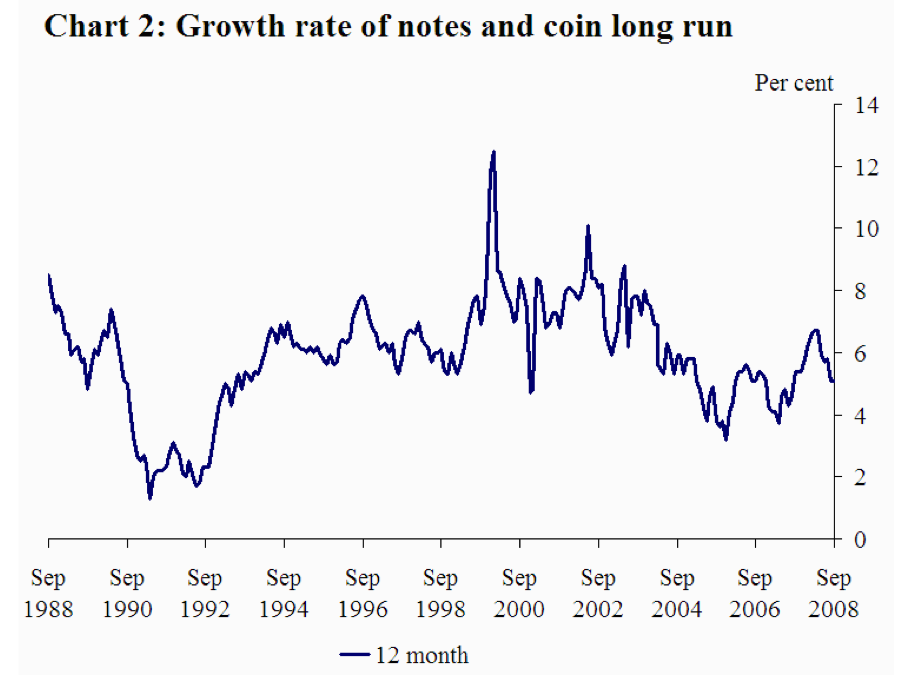
I used the three charts below in a presentation on 8th November 2008. Broad money didn't show any problems:
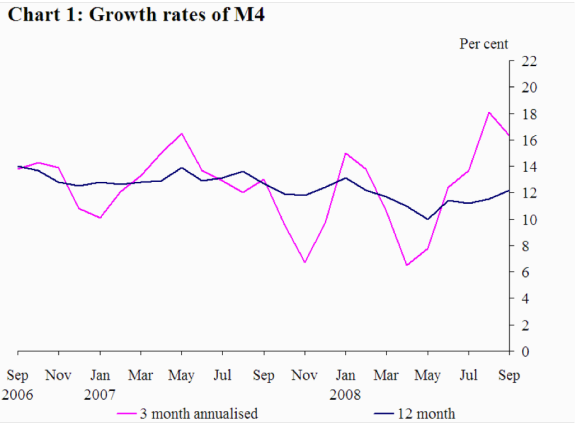
Narrow money didn't show any problems:
And then there was the "Austrian" measure:
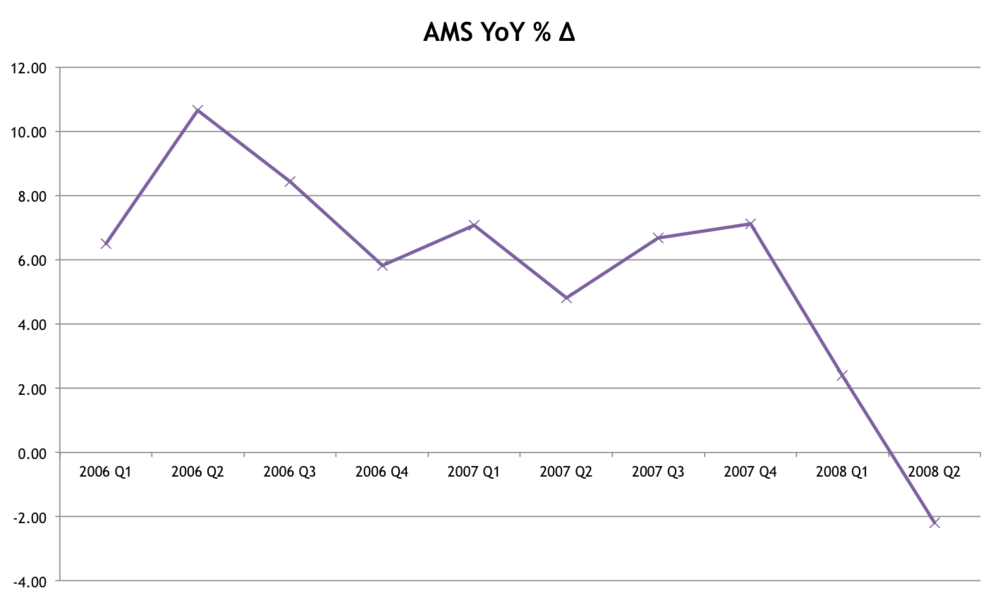 Given that the method of constructing the UK Austrian Money Supply has changed since then I was right to not draw too much emphasis to the warning signs at the time. But it signalled to me that us Austrians had something important to say and my confidence rose. Then, in January 2010, the Bank of England switched its conventional measure of broad money from M4 to M4ex, which stole a lot of my thunder:

Suddenly the value of the Austrian school switched from accurate forewarnings to the policy debate. In terms of QE, I think there's a narrow debate and a broad debate. The narrow debate is about whether QE will achieve it's stated aims and if this is broadly desirable given the current monetary regime. The broader debate is whether this "success" comes at the expense of unintended consequences (which may possibly be greater). Both of these debates rest on a firm understanding of what QE is, and how it differs from "conventional" monetary policy. Whe QE was first touted I had zero knowledge of the Japanese experiment. I'm happy with my contribution to clarifying what QE was, but perhaps focused too much on the broad, as opposed to narrow debate. Over time, this may be vindicated, because those broader concerns may becoming increasingly relevent. But in 2009 I was behind the curve in being able to make insightful commentary on that narrow debate.
Here are some of the key points I was trying to make:
1. QE is "merely" OMO
From the get go I was uneasy with the distinction between conventional monetary policy (cutting interest rates) and unconventional monetary policy (printing money to buy bonds - i.e. QE). Since QE is conducted via open market operations (OMO) it is more of a tweak to conventional monetary policy (i.e. targeting a quantity of reserves, rather than price/interest rate) than a replacement. In January 2009 Alistair Darling said,
- “We are looking at a range of measures to support the economy, to support business and to help people. But nobody is talking about printing money.
I don't think politicians should be allowed to deny that QE involves printing money and that central banks are routinely printing money. My response,
- "QE isn't a different policy tool, it's an alternative way of using current policy. Whereas OMO means targeting a particular interest rate (and altering the money supply to hit it) QE means targeting a particular quantity of money (and ignoring the interest rate)" [see here]
As I put it in my 2009 Comment is Free article,
- “1) QE is printing money; and 2) the printing press is already turned on.” [1]
In March 2009 I criticised a Financial Times video that attempted to explain QE because it:
- “propogates the myth that this is fundamentally new policy - as if the Bank of England is only now being "inflationary", and "printing money".” [see here]
Tim Congdon has also made the point that QE is standard monetary policy for the situation we were in
- “He [Tim Congdon] challenges Gordon Brown's portrayal of his own role in the financial crisis, arguing that instead of the response being his ‘brainchild’ the then Prime Minister required a layman's briefing and did not grasp the orthodoxy of the policy for situations when nominal income is falling” [5]
Verdict: I stand by this. In fact, I think this is a strength of QE and should be why QE becomes even more conventional.
2. QE is one arm of the state financing the other
Stephanie Flanders confirmed that "printing money" is technically accurate, but defended QE:
- “we can expect the Bank to buy a lot of gilts as part of this policy. Is that "printing money"? The politicians will say no. But any economist would say yes...
- ... "When the Bank of England buys up gilts, one arm of the government is buying up debt owed by another arm of the government in exchange for money created by the central bank. Whether the gilt is brand new, or issued the day before, is quite simply irrelevant.”
I made this "two arms" debate in a 2009 article:
- “despite the obfuscatory terminology, QE is nothing new. It is simply an exotic label for a discredited policy – one arm of government buying up the debt of another” [1]
Perhaps this was OTT. According to Flanders,
- “That said, there are big practical differences between this policy and Zimbabwe-style money financing. The most important is that the Bank is choosing to buy gilts as a means to an end. It is not being forced to buy them because the government has nowhere else to go. –Also - and crucially - the Bank has every intention of unmonetizing the debt when the storm is past”
I was dismissive of the argument that QE isn't "printing money", and expressed concerns about public finance. I felt that Flanders' point rested on semantics and intentions, and the public finance considerations shouldn't be dismissed so easily
- “Yes, the Bank of England is purchasing assets on the secondary market (not directly from the Treasury). Yes, the Bank has every intention to mop up this additional liquidity once the economy recovers, but "directness" and "intentions" are largely semantic.” [1]
- “the Bank of England buying assets on the secondary market is essentially a gradation of the policy that Mugabe’s government has unleashed in Zimbabwe. One arm of government is buying up the debt of the other. We can pretend that those two arms are separate, but that illusion is becoming harder to maintain by the day.” [4]
And indeed the Bank of England has now became a major player in the UK debt market (from a Kaleidic post):
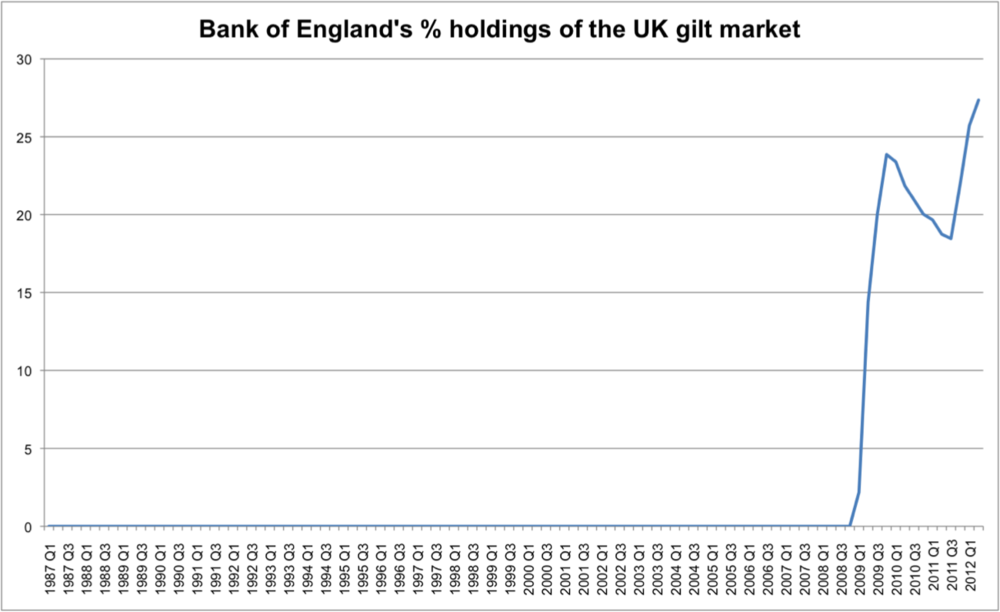
Verdict: I am glad I pointed out tangible downsides, but the jury is still out on the impact.
3. There is a risk of inflation
This is something many anti-QE commentators referred to, and we were wrong. We've not seen inflation anywhere near the scale we warned about. I said,
- “The biggest danger of QE – one that no economist would deny – is the destructive inflation that it unleashes. We are asked to have confidence that our monetary authorities have both the omniscience to know when inflation will shoot upwards, and the benevolence to act in the public interest when this occurs” [1]
I then attempted to provide some evidence for this claim:
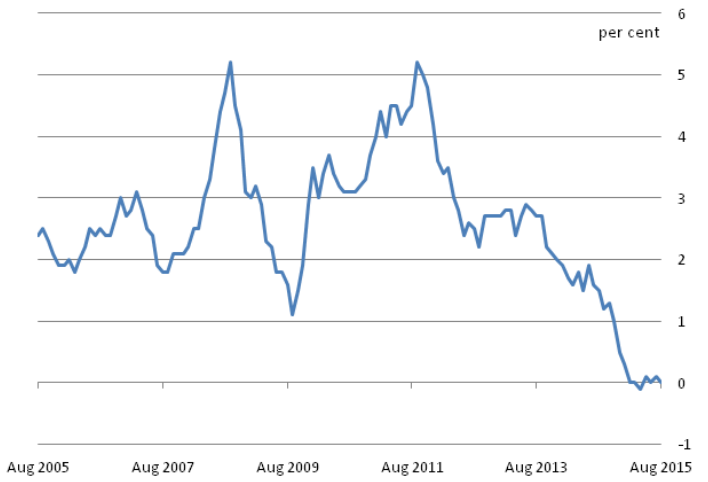
- “In February 2009 food price inflation rose to 9%, and factory gate inflation is at 3.1%, which might mitigate fears over deflation. We are in for another bout of inflation; another bubble is brewing. The party isn't over” [1]
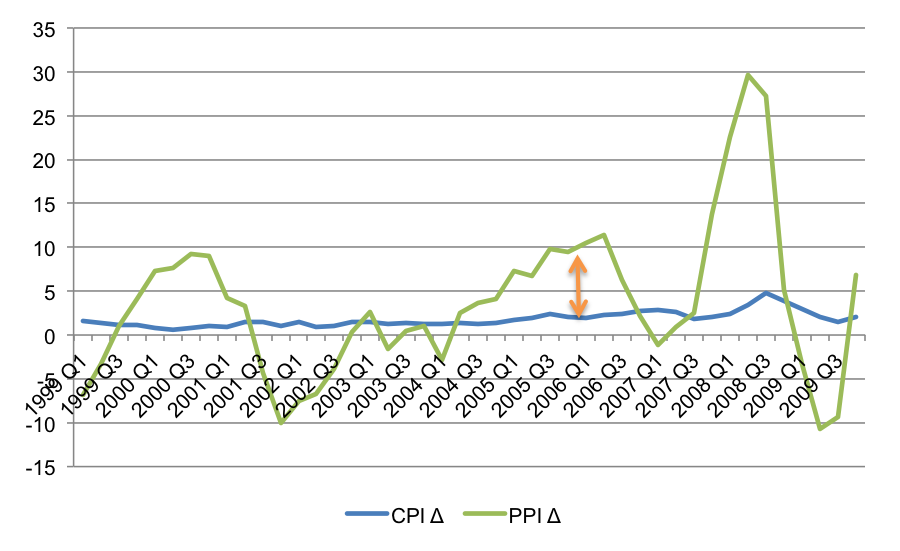
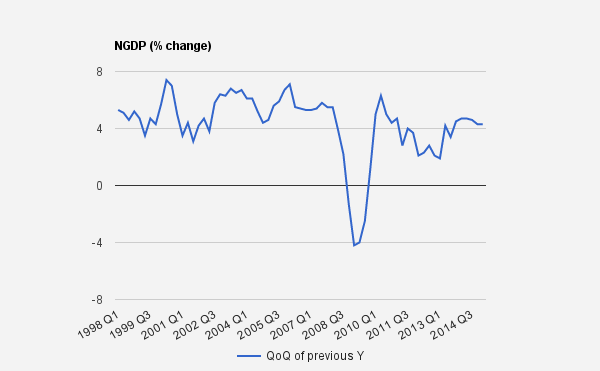
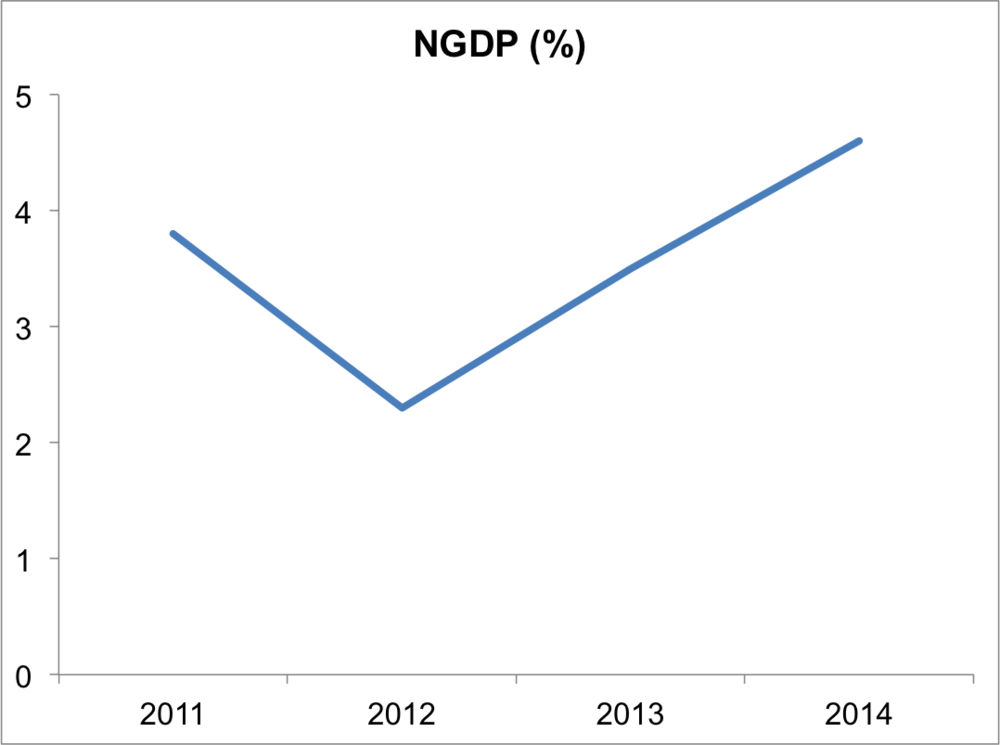
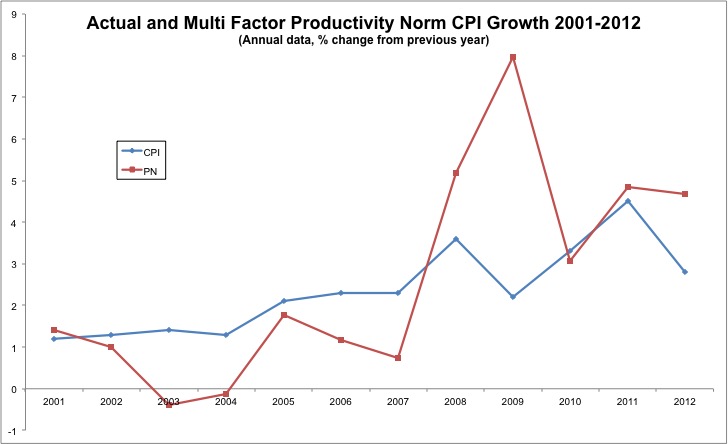
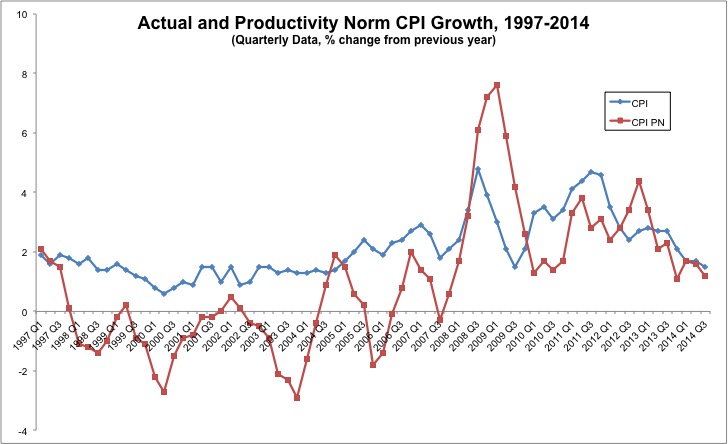
The chart above shows CPI from 2004-2014 and in Feb 2009 I was warning about inflation. As you can see, it promply falls to around 1%. However, QE starts March 2009 - February 2010 which is the period in which CPI is in a trough. The consequence is that in 2010-2011 we see inflation rise to over 5%. So I could say "there's the inflation", and QE advocates could respond "it's hardly Zimbabwe!"
Indeed already by February 2010 I was saying:
- "the inflation risk appears to be lower than first feared. Inflation expectations are contained, and yields remain low. Whether this can be maintained is another matter. The decision to cease QE indicates a concern that the inflation tiger is about to bite. Today's figures show a sharp rise, and we should not ignore the possibility that UK gilts are merely a new bubble." [3]
And then in November 2010,
- “monetarists are right to mock scaremongering about hyperinflation… CPI is above target (3.1%), but not to the extent that I (and others) feared… [But] We should also remember that inflation could manifest itself in asset price bubbles, for example in the gilt market or emerging markets” [4]
That said, I think I was successful at avoiding the claim that QE is a sign of loose monetary policy. Indeed:
- “those who believe that low interest rates and a fast growing monetary base imply expansionary monetary policy make the same mistake that economists made during the Great Depression. Then, as now, they were actually signs of an inept central bank failing to offset a fall in the broader money supply.” [4]
Verdict: I was wrong, but shifting the argument slightly reveals the kernal of truth.
4. QE is hair of the dog monetary policy and generates malinvestment
If loose monetary policy caused the crisis how can loose monetary policy get us out? The hair of the dog argument is a convenient one to make, as I did in 2009:
- “the Bank's solution is a larger dose of what caused the original disease.” [1]
- “We are now seeing the inevitable hangover and are faced with choice – either to go through the painful but necessary recovery (a hangover) or simply to prolong the intoxication… QE is more hair of the dog.” [1]
This leads to a related idea that a liquidation is a necessary consequence of a boom. Once you accept an Austrian style boom then a recession is an inevitable and necessary consequence. In this 2009 article for Comment is Free article I reeled off some standard arguments:
- “Over the last few years we have seen an unsustainable boom that has been financed through impoverishment. During this boom scarce capital has been squandered. Rather than use credit as a foundation for wealth-creation, it was erroneously treated as actual wealth, and consumed” [2]
- “a decline in output is an important step towards production that more closely matches consumer demand. If GDP growth has been driven by bubble activity, a fall in GDP is therefore an inevitable and necessary stage of recovery.” [2]
- “Genuine economic growth will only return if relative prices can adjust, malinvestment gets liquidated, and a correction is allowed to occur.” [2]
- “the recession itself is a sign that markets are adjusting, and that entrepreneurs are engaging in the recalculation that is required to understand which plans were unprofitable and where capital should be reallocated. Allowing relative prices to adjust as quickly as possible, reducing labour market rigidities, and improving labour mobility will all help with this" [4]
Verdict: If the inflation argument is over simplified monetarism, then this is over simplified Austrianism. I totally neglected the distinction between a primary and secondary recession and ignored the possibility that such declines in output were unnecessary.
However, by 2010 I was making a more distinct monetary equilibrium argument:
- “There is a plausible free market argument to say that under certain institutional conditions (such as competitive banks and no moral hazard), increases in the money supply to offset changes in the demand for money would avoid adjustments having to take place through the notoriously ‘sticky’ real economy. In the same way that inflation creates real effects, so does a monetary deflation, and these effects are neither desirable nor necessary.” [4]
- "A further argument that Austrian's might be interested in, is the distinction between an expansion in the money supply to offset an increase in the demand for money, and an expansion in the money supply as a means to stimulate aggregate demand." [see here].
And in an IEA article published in March 2011 I was a lot clearer:
- “Austrian economists are happy to acknowledge that under certain theoretical conditions QE can work as Congdon suggests – when the demand for money rises a corresponding increase in the supply can restore monetary equilibrium without forcing an adjustment to take place through prices and output” [5]
- “the best hope for monetary policy was that it prevented the ‘primary recession’ caused by the bubble unwinding turning into a "secondary recession" that sucked in the whole economy.” [5]
- “just as the monetarist view is too rosy, the Rothbardian view is too pessimistic.” [5]
Verdict (2): I got there in the end
5. Unintended consequences of setting a precedent
In February 2010 I published a Guardian article that softened my critique of QE:
- “To judge whether it worked depends on what would have happened without QE, and economists typically lack the toolkit to engage in rigorous counterfactual analysis.” [3]
- “Even if we understood better how the economy would look without the actual policy responses, determining whether they "worked" implies we understand the intentions of the primary decision-makers. Only then would we know if the actual outcomes match the intended consequences” [3]
Part of the problem with QE is that it reuqires an exit strategy, and we entered it without having a clear one:
- “The excess liquidity that QE creates will find its way into the real economy at some point – possibly after the economy has already begun to recover naturally – and this is why having an exit strategy is so important. Again, the more confidence markets have in the efficacy of such a strategy, the harder it is for QE to ‘work’, but doubts remain as to whether this can be navigated. Some argue that it’s simple to hike up interest paid on reserves, or possibly even confiscate such reserves when banks begin lending again. However, this overestimates the Bank of England’s ability to anticipate events.” [4]
I also relegated the threat of inflation as a consideration but pointed out the following:
- "the rules of the game have changed. The conditions under which QE would be rehabilitated aren't clear." [3]
A key issue is the danger it becomes semi-permanent. In a Management Today article, published January 2012:
- 'The Bank of England’s policy rate has been historically low for some time now and this cannot continue indefinitely. The aim of low interest rates is to boost the economy by creating incentives to borrow money and invest. But higher capital requirements and policy uncertainty create counter forces that restrict bank lending. [7]
- 'In these circumstances the purported "benefits" of low interest rates fail to materialise, but the costs certainly do. These include the lack of an incentive to save (and actually rebuild banks' balance sheets through voluntary lending), distortions to the capital structure of the economy (making white elephants like the HS2 line appear profitable) and the erosion of people's savings. [7]
- 'The fact that real interest rates (the difference between inflation and the return you get on your savings accounts) is negative is a harmful confiscation of wealth. [7]
- 'When interest rates are close to zero policymakers look to alternatives, and quantitative easing has emerged as their favoured tool. However grateful banks and the financial community are in general to have an injection of freshly-printed money, it’s not clear how much this is helping the real economy. The aim shouldn’t be to preserve the status quo, but to find ways to allow banks to fail without exposing the general public to the fall-out.' [7]
In November 2010 I said:
- “the use of QE to boost aggregate demand (rather than prevent a liquidity meltdown) is a precedent” [see here]
- “there can be a fine line between “stabilising MV (money supply multiplied by velocity)” and “boosting AD (aggregate demand)” [6]
Verdict: QE needs to be reformed and there's a real danger that it simply becomes another source of stimulus.
6. Back door bailouts
I try not to engage in banker bashing, but was unable to resist the temptation:
- "banks have benefited. QE served as a bailout by the back door. By enlarging the scope of assets it buys, and printing money to fund them, this creates (alas perhaps literally) a get-out-of-jail-free card for profligate bankers." [3]
- “Whilst many businesses have benefited from being able to issue more commercial paper (as the second Giles video points out), the main beneficiaries have been the banks. For very good reasons the Bank of England is not supposed to directly finance UK government debt. This is the cause of most hyperinflations, and is "one arm of the state directly financing another". But they are able to buy them on the secondary market. This makes a massive arbitrage opportunity for banks that buy up gilts and sell them on to the Bank” (see here)
Verdict: A bit crass.
What I should have done is emphasised the importance of liquidations in market corrections and the role of central banks at ditinguishing between liquidity and solvency crises. In 2010 I tried to make this point, arguing that a downside of QE is that it masks solvency problems:
- "The original reason for having a lender of last resort was to provide emergency liquidity during a bank ‘panic’ and to help unwind unsound banks so that they wouldn’t pose a systemic risk. As time has passed since the first round of QE1 we have realised that it wasn’t merely a short-term liquidity problem, but a fundamental one of solvency. This cannot be cured with a quick gush from the monetary spigot, and direct bailouts merely obscure the distinction between liquidity and solvency problems further.” [4]
Perhaps this is too simplistic because they way in which QE is conducted can determine whether it's providing a Bagehot style penalty or a back door bailout. In March 2011 I said
- "In a world where central banks exist, this is the mechanism by which we distinguish between the temporary illiquid to the fundamentally insolvent. And unlike QE it avoids a slew of unfavourable side effects, such as expanding the scope of the Bank of England (by redefining the types of assets and types of institutions they deal with); expanding their discretionary powers; generating regime uncertainty; increasing the upside risk of inflation; and placing epistemic burdens on policymakers that there is no hope they can shoulder.” [5]
- “why can't the Bank of England simply fulfil its traditional role as being lender of last resort” [5]
Back then, I felt that the Bank of England should use discount window. Now, I believe QE could be used in a way that is better than a discount window.
Conclusion
In November 2010 I wrote a think piece for the Adam Smith Institute, and stand by the main argument:
- “Policies like QE increase regime uncertainty and generate systemic instability. They have the potential to make matters worse, and ignore the fact that you cannot buy confidence. The Bank for International Settlements – one of the few organisations that foresaw large elements of the financial crisis – warns about the upside risk of continued low interest rates. Systemic misallocation of capital (including human capital) remains. Excessive risk-taking remains. Over-leveraged balance sheets remain. Volatile capital flows remain.” [4]
However I argued that QE had run it's course
- “There is an alternative to more QE.” [4]
Now, I believe that I should have explained what it is good for, and clarified what those alternatives are. The justification for QE was to prevent a collapse in commercial banks balance sheets and reduction in broad money growth. But the main reason for this problem was an exogenous policy shock, namely an increase in capital requirements.
So, mea culpa:
- I didn’t have a good grasp at to what was happening to the money supply at the time - broad money growth data was flawed
- I was treating the ceteris as paribus, believing that if the problem was regulatory intervention the solution is to remove that intervention, rather than introduce new ones
- Quibbling about how QE was conducted (and not having a clear alternative) was less important than generating liquidity
- I placed too much weight on the long term, unintended consequences of QE
Then, my main policy sympathy would have been to implement Bagehot through discount window and keep provision of market liquidity separate
Now, however, I think that the problem was OMO being too narrow. If you have a “small number of counterparties” and a “small subset of “good” securities”, then a ““Bagehotian” case can still be made for occasional direct Fed lending”. However if OMO function well or are reformed (i.e. diversify the participants and diversify the assets) then that’s how Bagehot should be implemented. (See this George Selgin article for more).
I maintain that hair of the dog isn't effective monetary policy, and so the central bank should not be there handing out shots. But they do have a role in easing the hangover by handing out water. And given that they won't always know where it's needed, soak the market with liquidity and see where it goes.
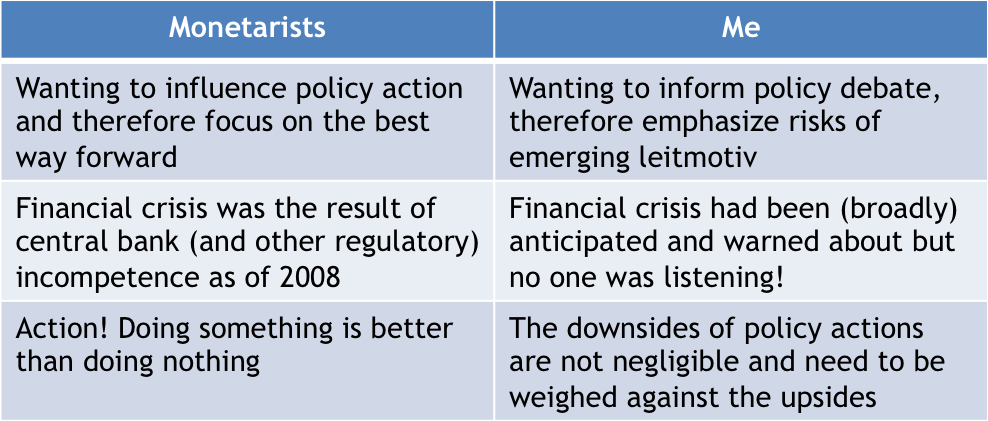
Here's how I'd summarise the debate:
References:
- “The semantics of printing money” The Guardian, March 2009
- “The unpalatable financial truth” The Guardian, March 2009
- “Has quantitative easing paid off?” The Guardian, February 2010
- “The Threat of QE2”, Adam Smith Institute, November 2010
- “Monetarists’ blind spot on quantitative easing” Institute of Economic Affairs, March 2011
- “Forward thinking”, Money Marketing, May 2011
- "To QE Or Not To QE? The Market Has Spoken” Management Today, January 2012