Austerity and the passage of time

Following the fourth meeting of Kaleidic Economics, we have released a report on the UK's austerity plans. Three main arguments are made:

  1. Temporary changes in the tax code are inconsistent with both sides of the debate
  2. We cannot ignore the historic state of the UK economy when discussing fiscal policy
  3. Alternative forecasts for GDP can make a dramatic difference to austerity measures

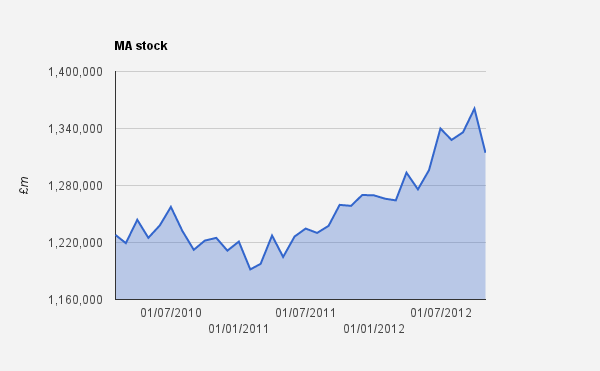
This chart shows government spending as a proportion of GDP, using a GDP forecast lower than the official OBR figures. It reveals that government plans to reduce spending are based as much on over optimistic growth forecasts as they are on actual spending cuts.

You can read it in full here (.pdf).

Quarterly Report No. 3 released

Following the March meeting of Kaleidic Economics we have released the 3rd Quarterly Report. The topic is the economic development of China and how it fits into business cycle theory. We identified and discussed the following key questions:

  • What is the right historical parallel?
  • Are GDP figures accurate?
  • How much growth is due to a housing boom?
  • Does economic growth translate into raised living standards?
  • Where are the brands?
  • Will China democratise?
  • Can policy errors be exported?

You can download the report here.

A comparison of monetary aggregates

The image above shows a range of measures of the UK money supply. Because of the scale it is hard to make out changes in any given measure, but the purpose is to see how they relate to each other in terms of scale.

It demonstrates how MA (in blue) is a narrow measure that incorporates more deposits than M1. I was surprised that M4ex is smaller than M2. We have also been playing around with a very broad measure, which is shown as MB. More news on that soon.

Update: the previous version used an area chart and showed the cumulative money stocks. We've now changed it to just show the money stock per measure (2/3/12)

Important updates to MA compilation

In January 2012 we made some important updates to our measure of the money supply (MA). These were primarily an attempt to simplify the compilation and ensure that the series we were using were compatible across various reporting institutions. Whilst the previous measure used various asset classes from the Bank of England's Divisia tables as the starting point, the new measure is simply defined as:

MA = Currency + Demand deposits

MA is really a measure of the money stock, as opposed to the money supply, and the chart below shows the total amount for as far back as the Bank of England data goes (Janaury 2010).

The chart below shows the difference between the growth rates in the 2011 measure of MA and the 2012 measure. This is obviously a major difference since the new compilation method is now pointing to a steadily increasing rate of monetary expansion, as opposed to a continued monetary contraction. We will continue to look into these issues and provide updates.

Kaleidic Economics publishes new indicator on private investment

In last week's City AM I published an article comparing private and government investment:

When private sector investment declines, then the reasons need to be identified and a solution found. The key policy question needs to be “why aren’t businesses investing?” Attempting to offset it with government spending is just an accounting deception. And too much government intervention can be the underlying cause, not the cure – through high tax rates, burdensome regulations and policy uncertainty.

The data I used came from the "Gross Fixed Capital Formation" of the National Accounts (Table F). There are four components:

  • business investment (NPEL)
  • general government (DLWF)
  • public corporations (KLQ9)
  • private sector dwellings (KLQ5)

In compiling the chart I added business investment and private sector dwellings to create "private investment", and used general government as "government investment". I excluded public corporations. The chart below shows the results, and this will be updated in the data section of our website.

October 2011 MA falls abruptly

In October 2011 our MA measure fell by 6.6% compared to the year before as the turmoil in the financial markets from the Euro crisis accelerated. This decrease is more accentuated than the 3.8% fall we calculated for September 2011. 

The Notes and Coins figure released by the Bank of England for October 2011 increased by 6.2% compared to the year before while M4 for the same period decreased by 2.9%. 

September 2011 MA continues decline

Our September 2011 MA figure accelerated its decline when compared to the readjusted* value for August 2011. In September, MA fell by 3.7% compared to 3.5% the month before. This was somewhat expected given the turmoil in financial markets at the time. 

Notes and Coins fell by 5.3% while M4 accelerated its decline from -0.8% in August to -1.6% in September.

*Note: As of November 2011, the Bank of England has readjusted some of the components we included in previous MA computations which naturally resulted in slight changes for some of our calculations.

Coverage in the House of Commons

Steve Baker MP in a speech to Parliament:

My argument, which is one Hayek advanced in his Nobel lecture, is that when employment comes from an increase in the money supply, that employment lasts only as long as the money supply increases, or perhaps only as long as it continues to accelerate. My preferred measure of the money supply comes from Kaleidic Economics. If we look at it, we find that from 2002 the money supply not only increased, but accelerated in its increase—the level was above 10% from 2004 and in 2007 it went as high as 27% by that measure. The money supply is now contracting at a rate of about 5% a year.

August 2011 MA falls by 4.3% YoY

August saw another YoY fall in MA, our money supply measure, though again at a decelerating rate compared to the previous two months. The figure was at -4.3% which is less than the -4.7% and -5.1% we saw in July and June respectively. This is an interesting result given that August was the month when the turmoil in the financial markets picked up. 

M4, the broad money supply published by the Bank of England also fell but only by 0.6% while N&C grew by 5.6% YoY.