Kaleidic Economics publishes new indicator on private investment

In last week's City AM I published an article comparing private and government investment:

When private sector investment declines, then the reasons need to be identified and a solution found. The key policy question needs to be “why aren’t businesses investing?” Attempting to offset it with government spending is just an accounting deception. And too much government intervention can be the underlying cause, not the cure – through high tax rates, burdensome regulations and policy uncertainty.

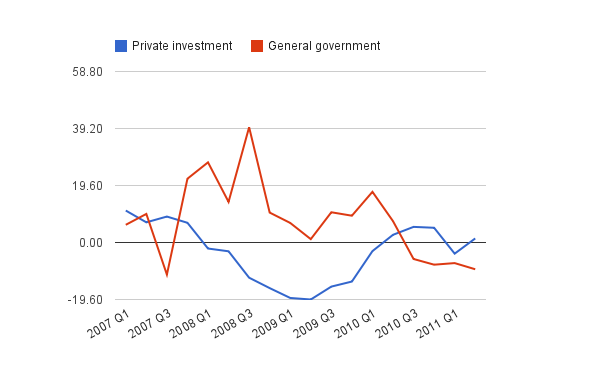
The data I used came from the "Gross Fixed Capital Formation" of the National Accounts (Table F). There are four components:

  • business investment (NPEL)
  • general government (DLWF)
  • public corporations (KLQ9)
  • private sector dwellings (KLQ5)

In compiling the chart I added business investment and private sector dwellings to create "private investment", and used general government as "government investment". I excluded public corporations. The chart below shows the results, and this will be updated in the data section of our website.

October 2011 MA falls abruptly

In October 2011 our MA measure fell by 6.6% compared to the year before as the turmoil in the financial markets from the Euro crisis accelerated. This decrease is more accentuated than the 3.8% fall we calculated for September 2011. 

The Notes and Coins figure released by the Bank of England for October 2011 increased by 6.2% compared to the year before while M4 for the same period decreased by 2.9%. 

September 2011 MA continues decline

Our September 2011 MA figure accelerated its decline when compared to the readjusted* value for August 2011. In September, MA fell by 3.7% compared to 3.5% the month before. This was somewhat expected given the turmoil in financial markets at the time. 

Notes and Coins fell by 5.3% while M4 accelerated its decline from -0.8% in August to -1.6% in September.

*Note: As of November 2011, the Bank of England has readjusted some of the components we included in previous MA computations which naturally resulted in slight changes for some of our calculations.

Coverage in the House of Commons

Steve Baker MP in a speech to Parliament:

My argument, which is one Hayek advanced in his Nobel lecture, is that when employment comes from an increase in the money supply, that employment lasts only as long as the money supply increases, or perhaps only as long as it continues to accelerate. My preferred measure of the money supply comes from Kaleidic Economics. If we look at it, we find that from 2002 the money supply not only increased, but accelerated in its increase—the level was above 10% from 2004 and in 2007 it went as high as 27% by that measure. The money supply is now contracting at a rate of about 5% a year.

August 2011 MA falls by 4.3% YoY

August saw another YoY fall in MA, our money supply measure, though again at a decelerating rate compared to the previous two months. The figure was at -4.3% which is less than the -4.7% and -5.1% we saw in July and June respectively. This is an interesting result given that August was the month when the turmoil in the financial markets picked up. 

M4, the broad money supply published by the Bank of England also fell but only by 0.6% while N&C grew by 5.6% YoY.